Elements: P-type and N-type
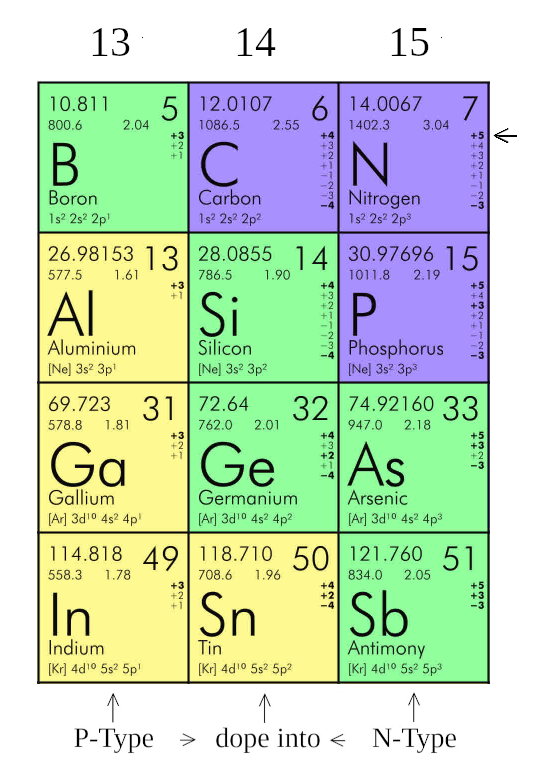
This section of the Periodic Table of the Elements shows a partial selection of columns 13 to 15 with valencies 3 to 5, respectively (see arrow). Column 13 are elements that can be added (doped) to elements in column 14 to create a P-type compound. Likewise, column 15 are elements that can be used to dope elements in column 14 to create an N-type compound. Silicone is the cheapest element in Column 14; therefore, this is often used as a base. For example, a lightly doped compound may be one Boron atom to every 100 Carbon atoms.
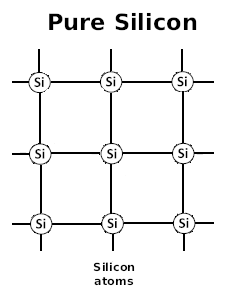
Pure Silicone has a valence of 4, meaning that it wants to form a matrix connected with four other atoms of Silicone. When two neighboring atoms of Silicone share an outer electron, we write this schematically as a line in place of two electron dots.
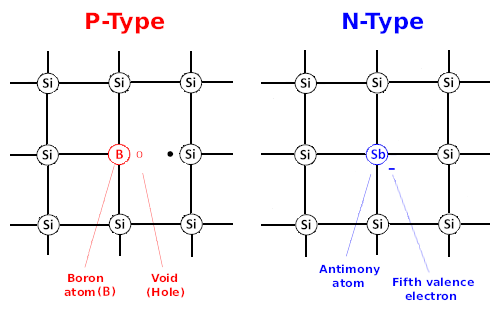
On the left is a P-Type compound created by taking a Silicone base and doping it with Boron (B). Since Boron has a valence of 3, it only wants to link with three other elements. This leaves a void, or hole. It is deficient of electrons. This creates an electron sink in which electrons want to fill the void. Conversely, you can think of this conceptually as the hole wanting to leave. Electrons are attracted and holes are repulsed.
On the right is an N-Type compound created by taking Silicone and doping it with Antimony (Sb). Antimony has a valence of 5, meaning that it wants to link with five elements. This leaves an extra electron floating in the matrix. There is an excess of electrons. Therefore, electrons are repulsed and holes are attracted.
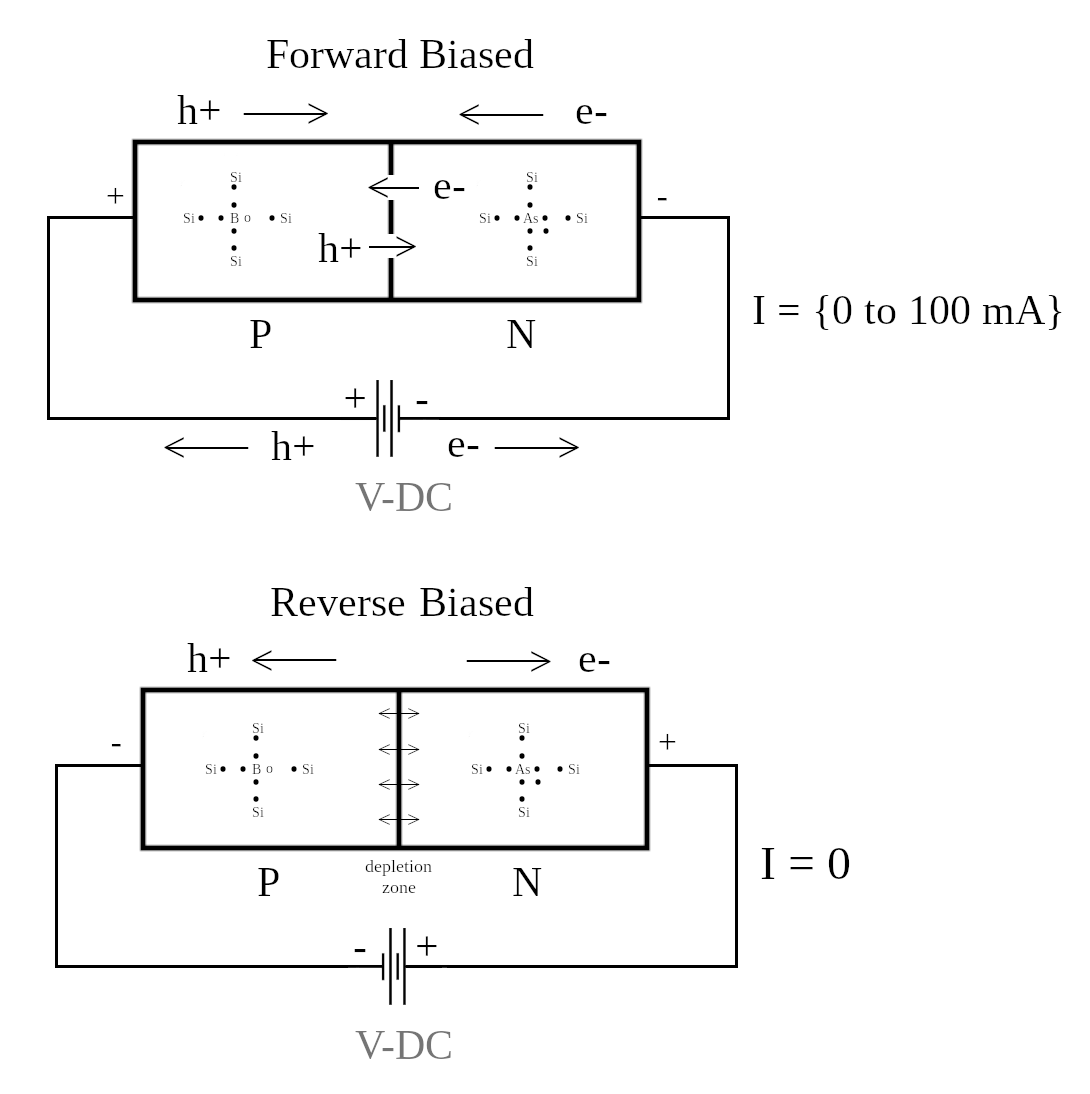
In Forward Bias positive current (holes) leaving the battery from the left creates enough potential energy to push the holes past the PN junction inside the diode. Likewise, from the right the negative current pushes in the opposite direction and repulses the electrons past the PN junction. Typically this occurs when the potential energy exceeds 0.7 volts.
In Reverse Biased the battery electrodes are reversed. Now the positive current from the right pushes against the N-type material. This causes the electrons to be attracted, and pulled away from the PN junction. The opposite is true on the left. This causes a depletion zone to occur, and no current is created (I=0).
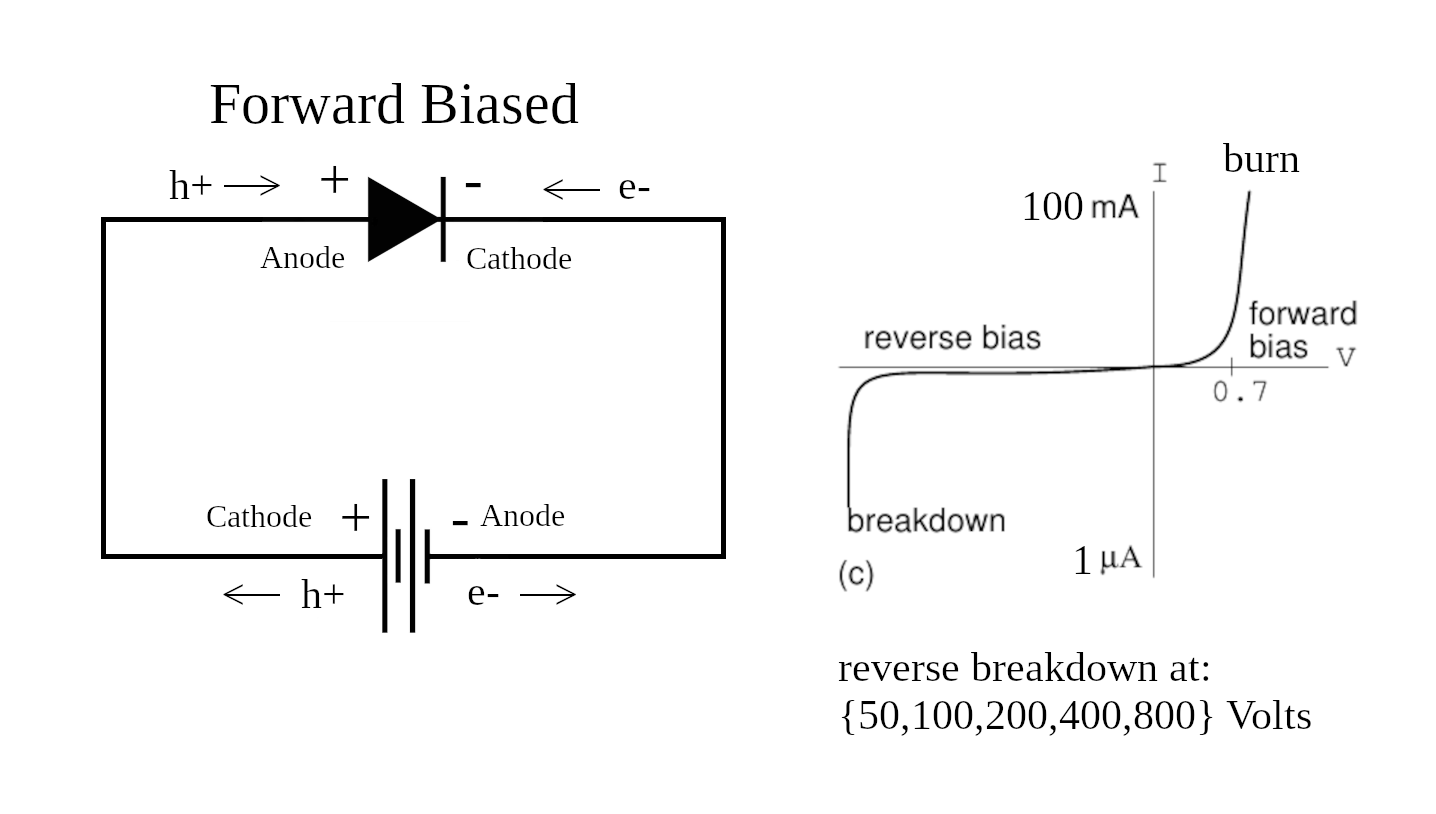
In the case of forward bias, the graph on the right shows that as positive voltage is applied, nothing happens until you reach a value of about 0.7V, then current rises exponentially. In reverse bias, the graph shows that no current occurs in the negative direction until, at a huge amount of voltage, the diode breaks down.
Note: Alternating Current (AC) creates a forward and reverse flow of current. When a diode is placed in AC current, both a forward and reverse bias is created.
Oscilloscope
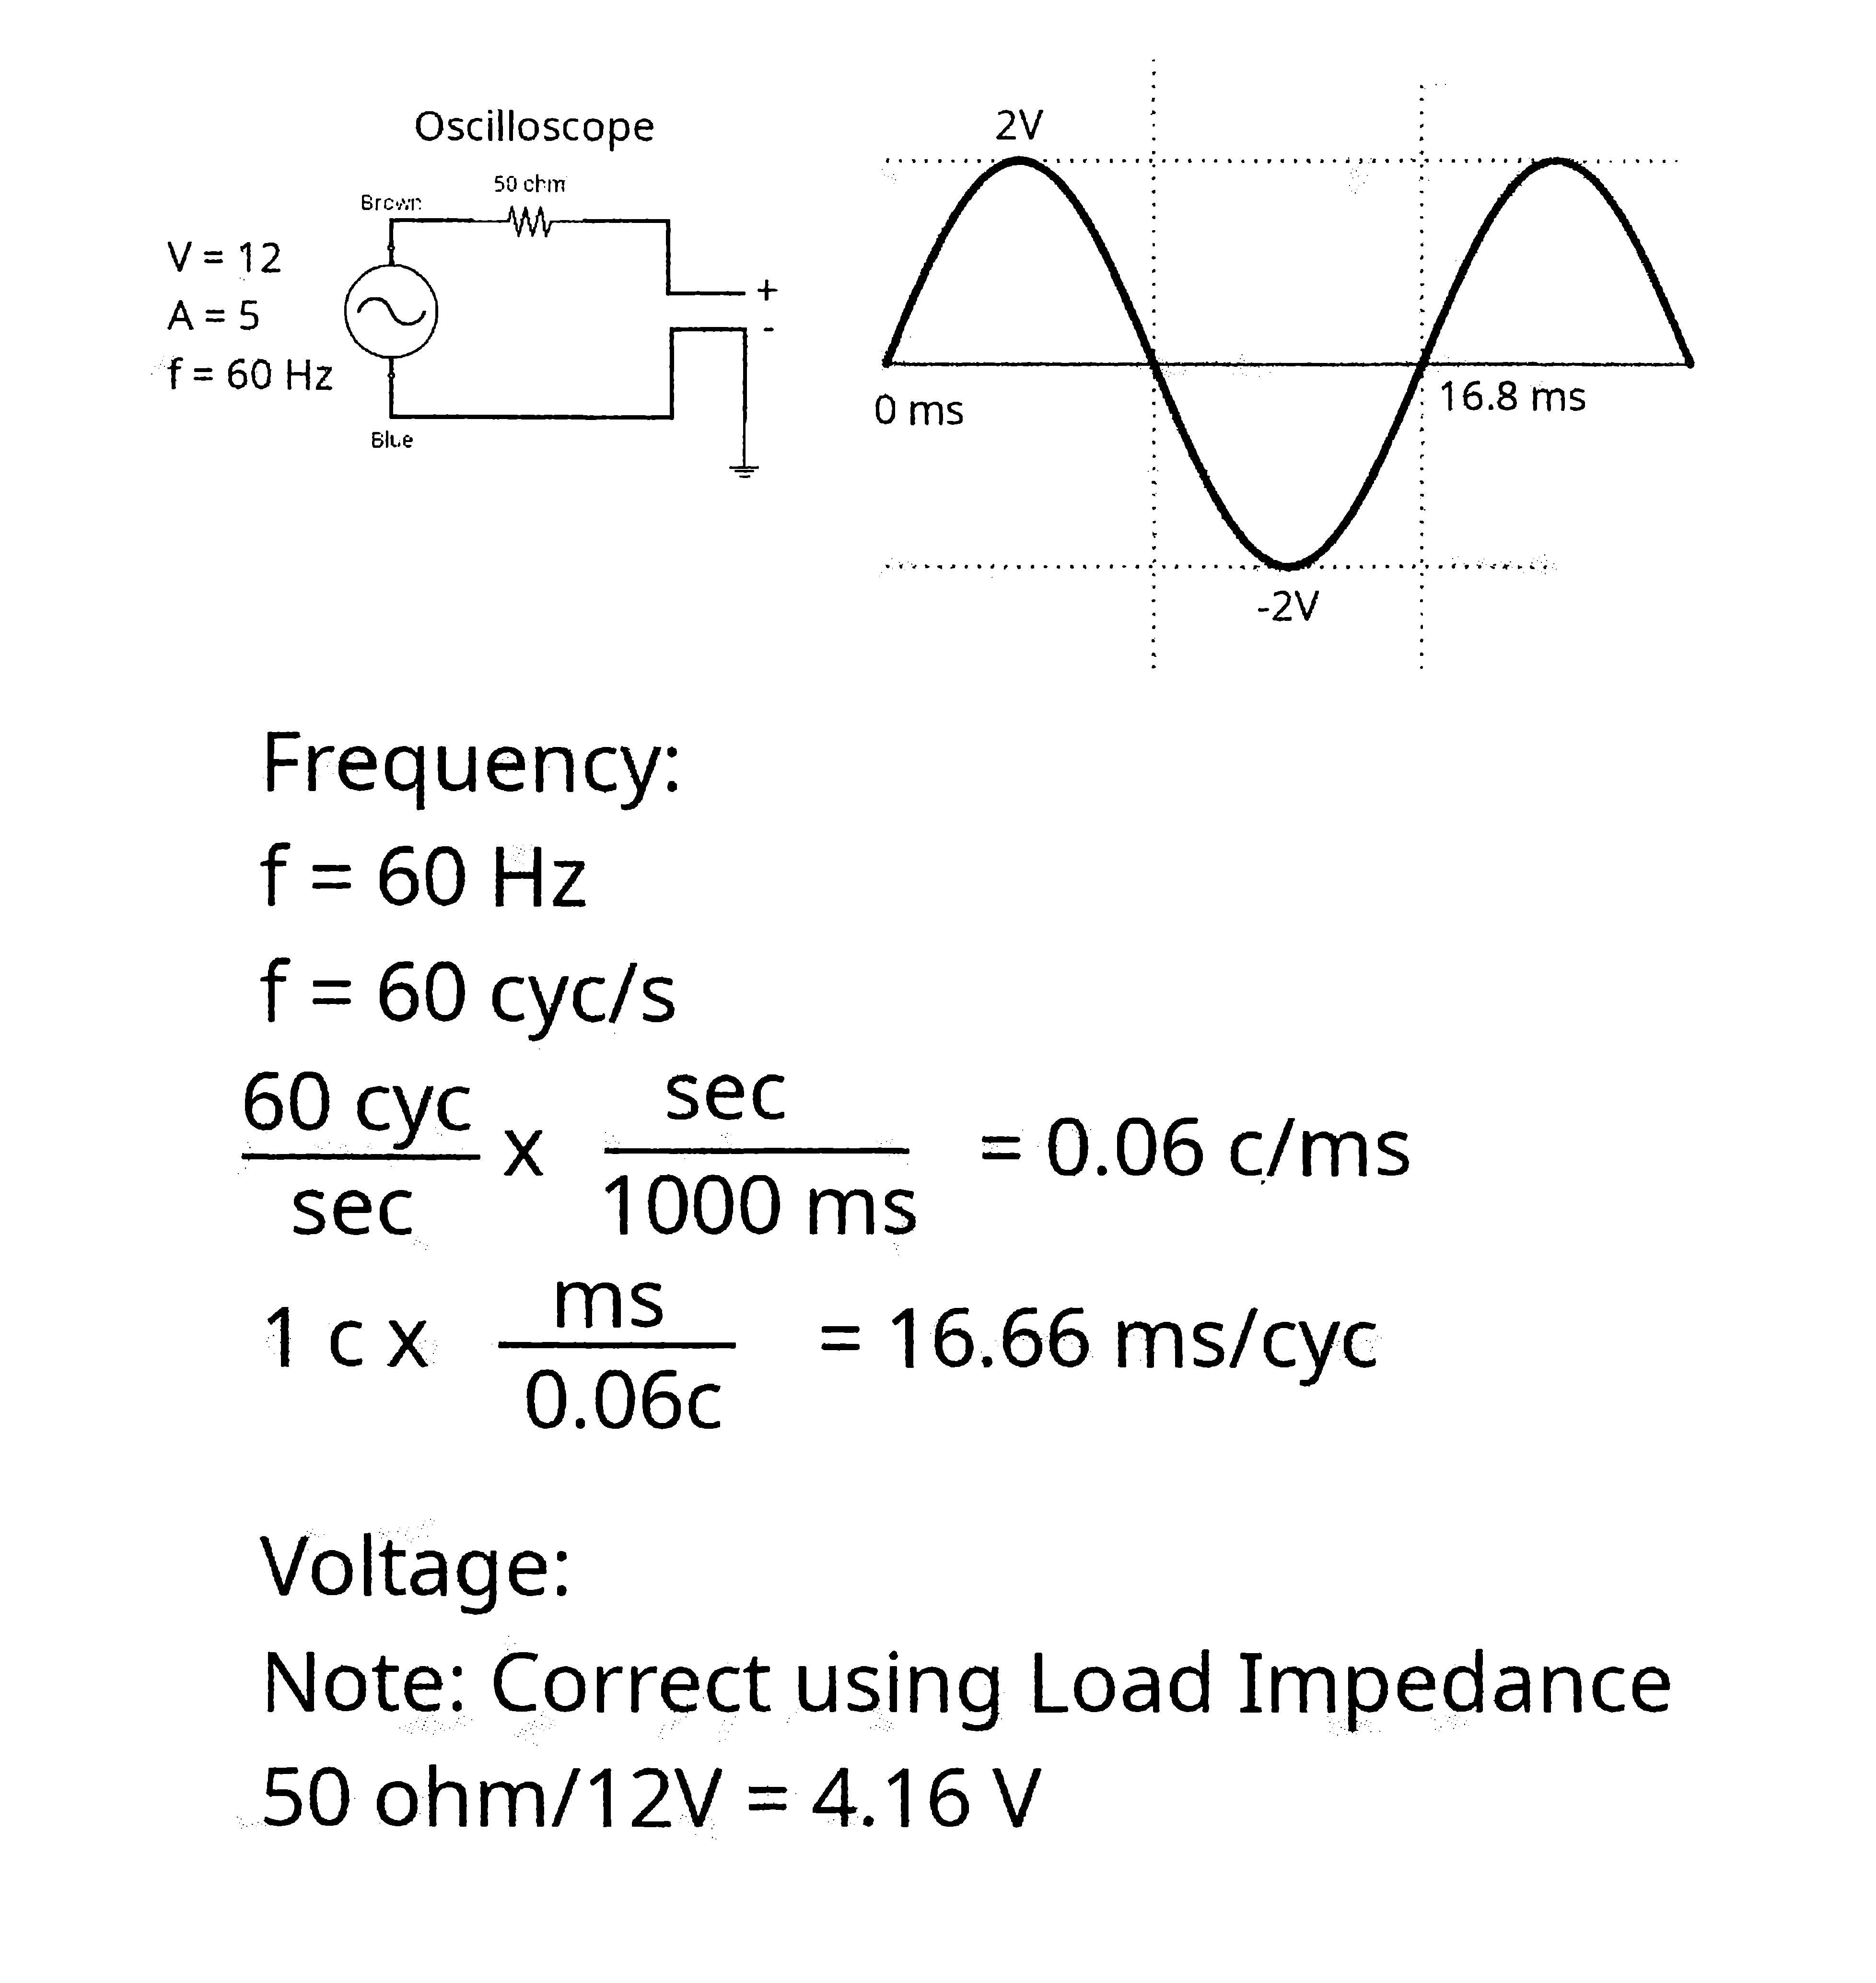 Theory: The source is AC current with 12V, 5A and frequency (f) = 60 Hz. On the oscilloscope, this produces a sine wave with a peak of 2V, and a trough of -2V. This is because the oscilloscope has a 50 ohm circuit (50 ohm/12V = 4.16V (divide by 2 to give positive and negative values). One cycle is 16.66 ms/cycle. |
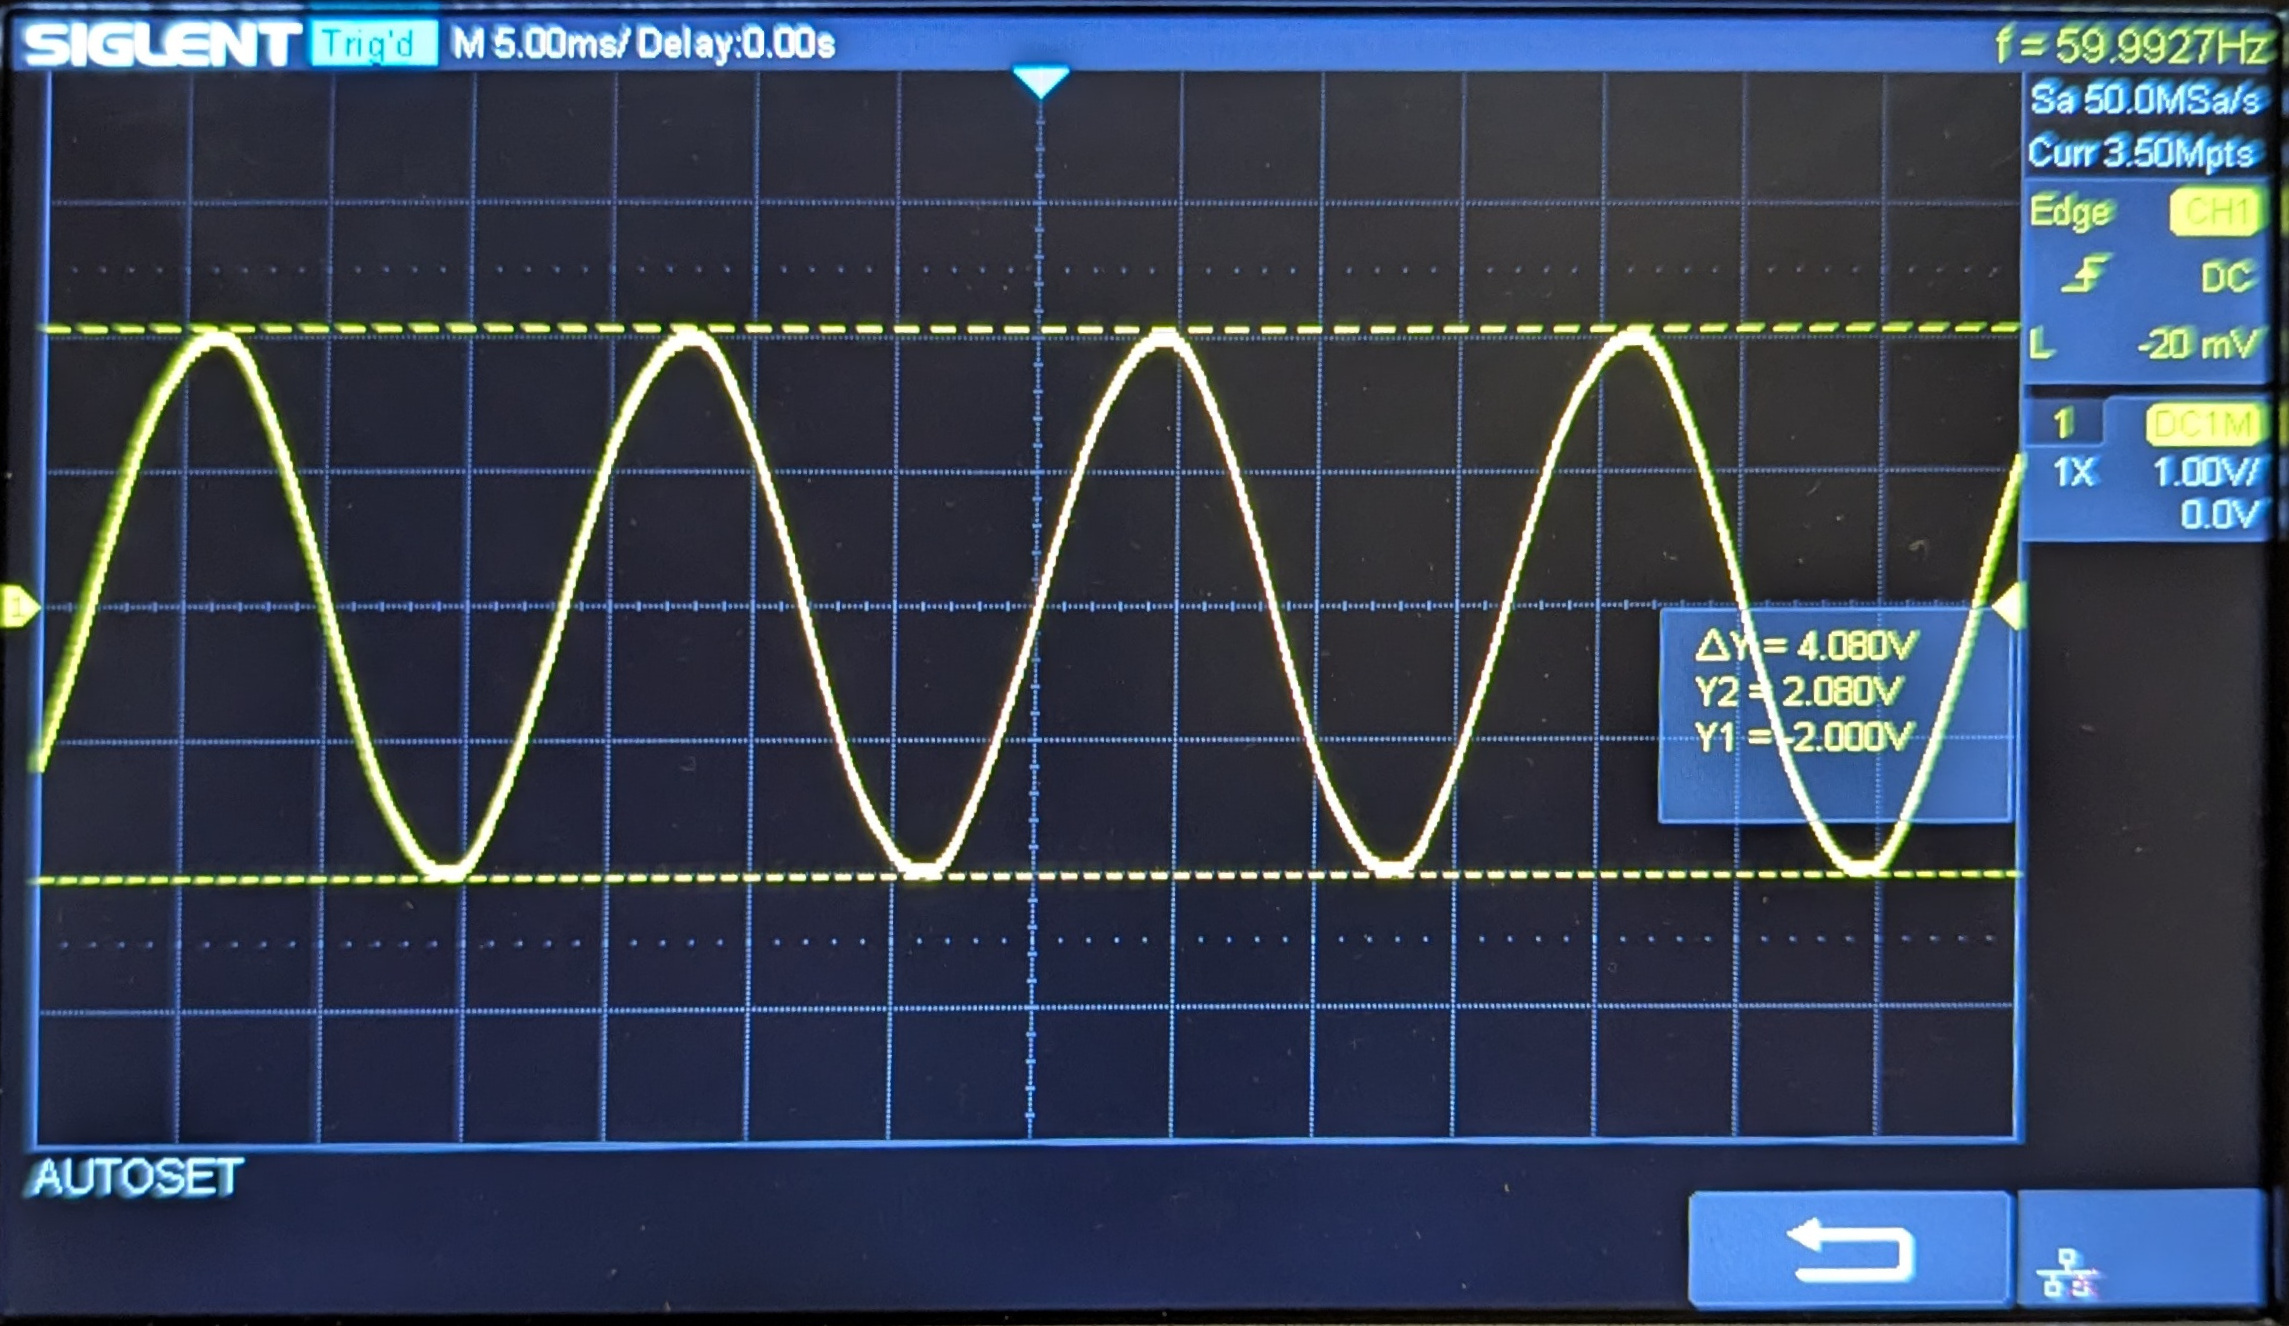 This is a sine wave produced by the AC output with Y1 = -2V and Y2 = 2V with a difference (ΔY) of 4.08 V. |
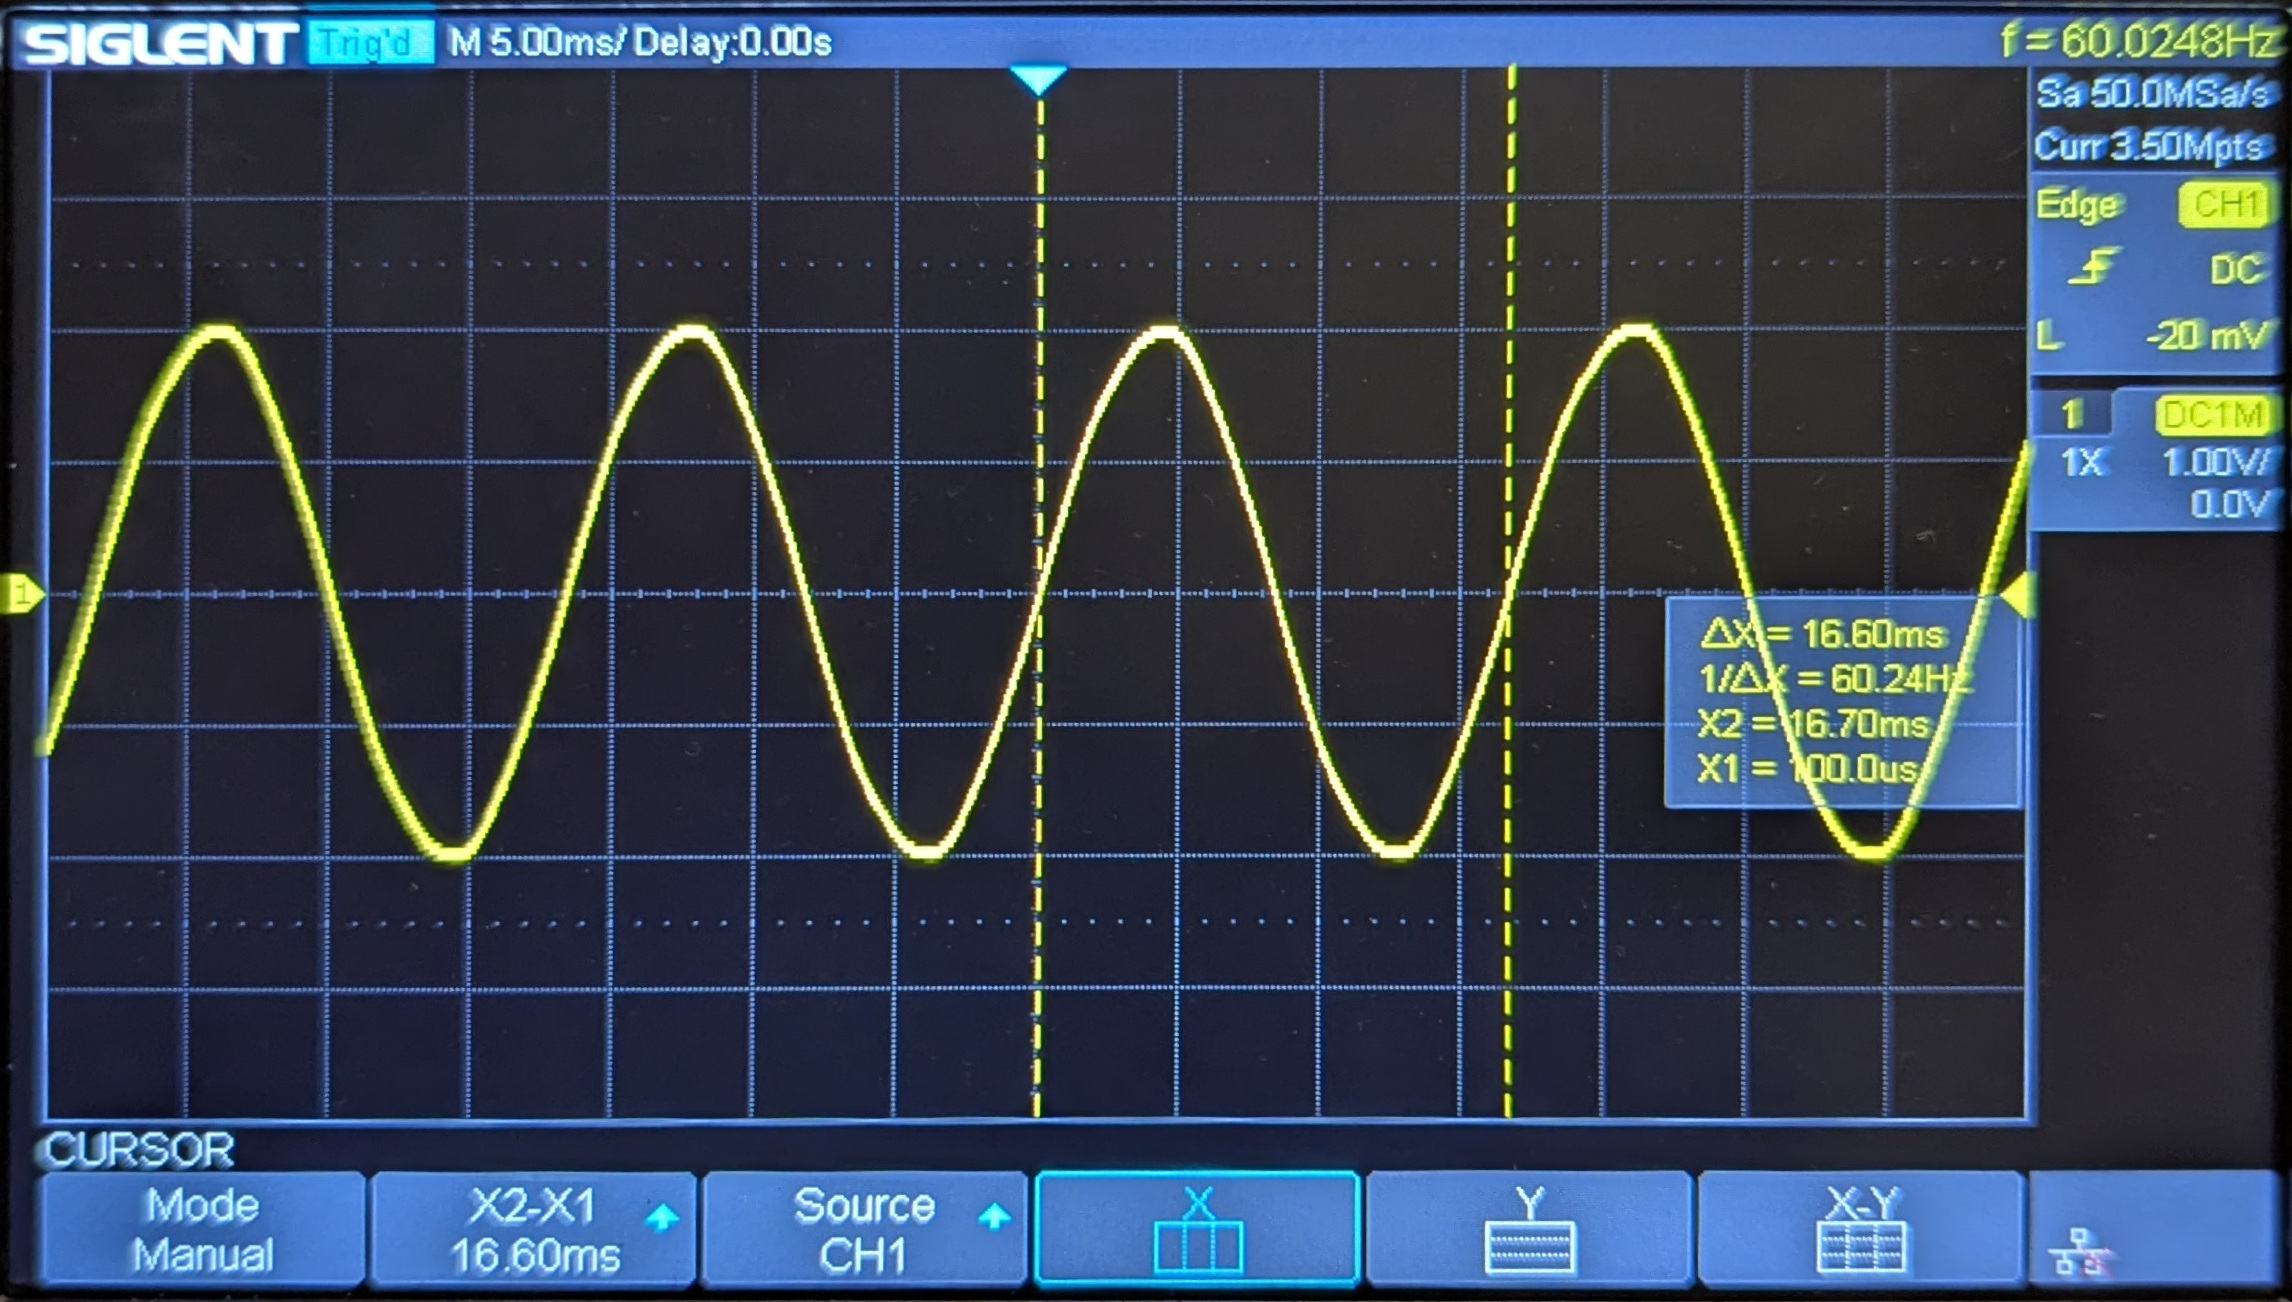 The same wave measured using the x-axis with a single cycle = 16.60 msec per cycle. |
Diodes
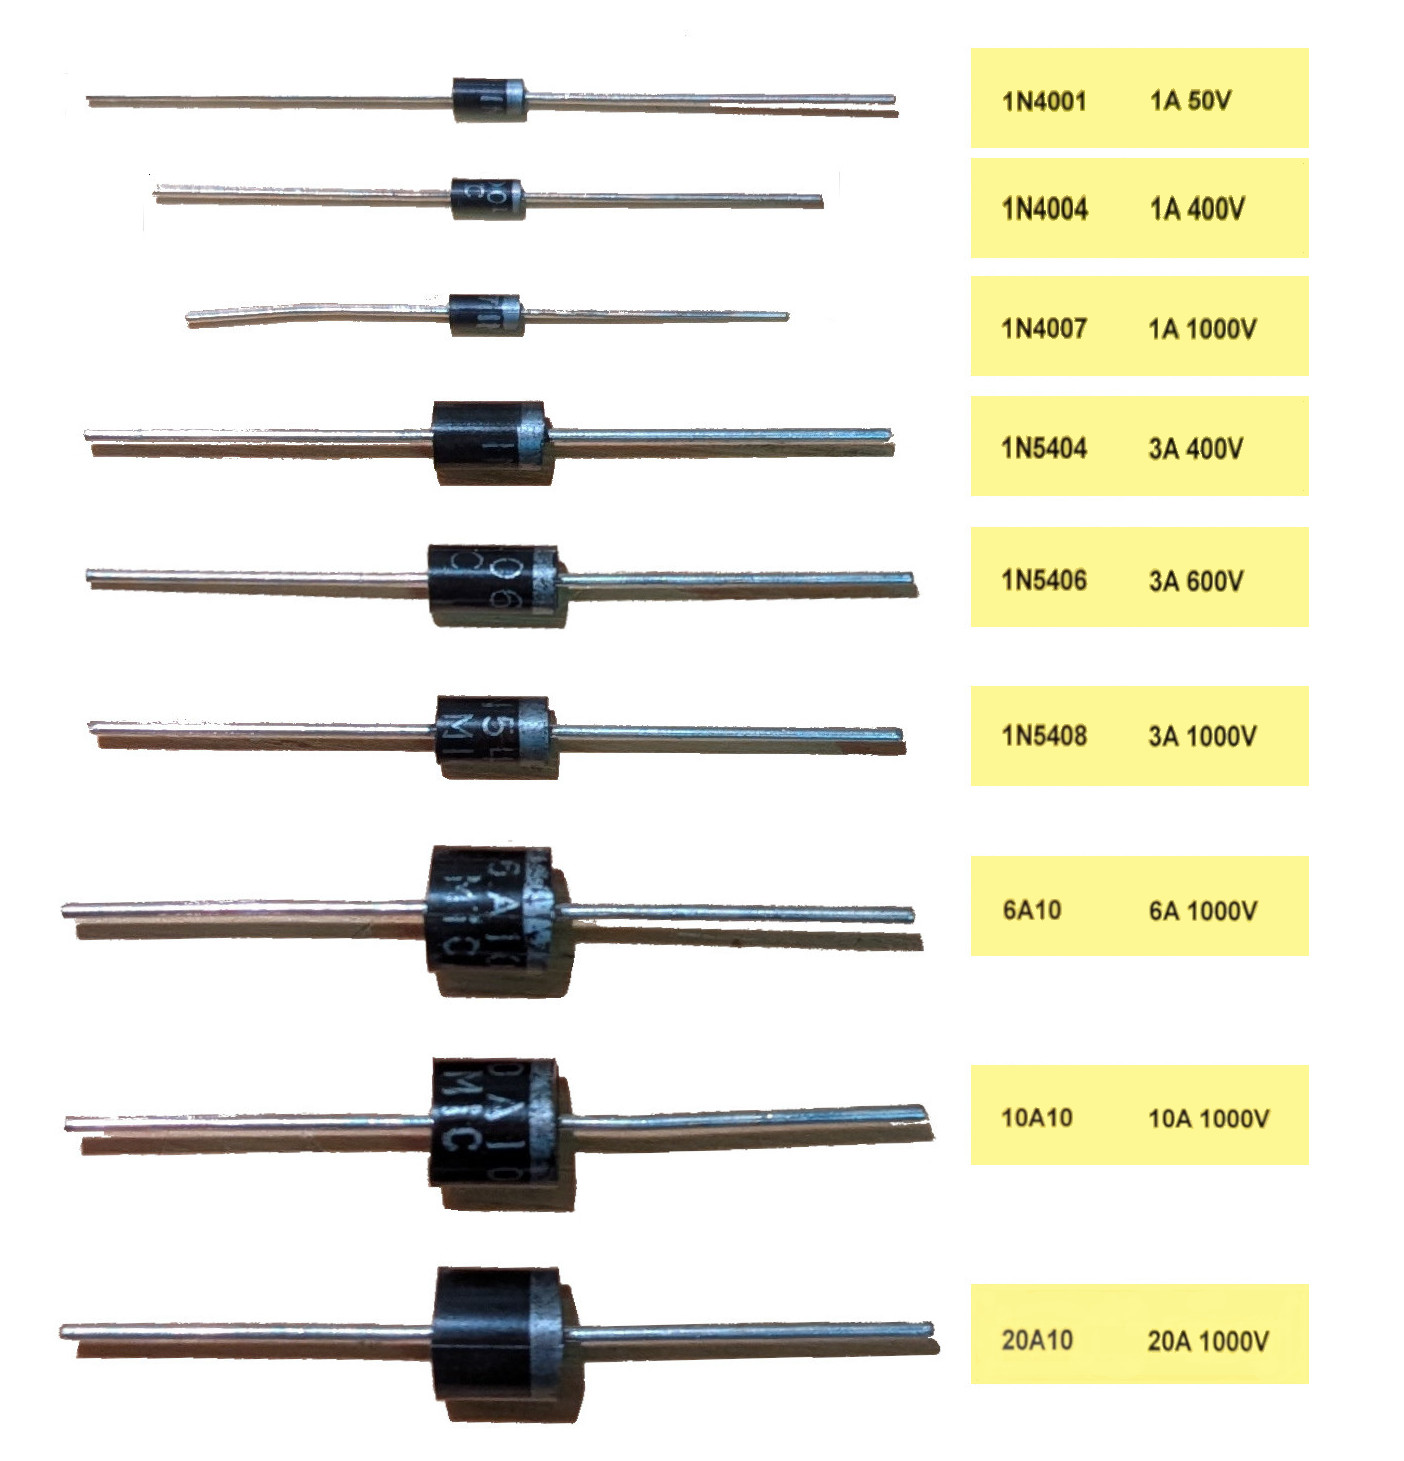
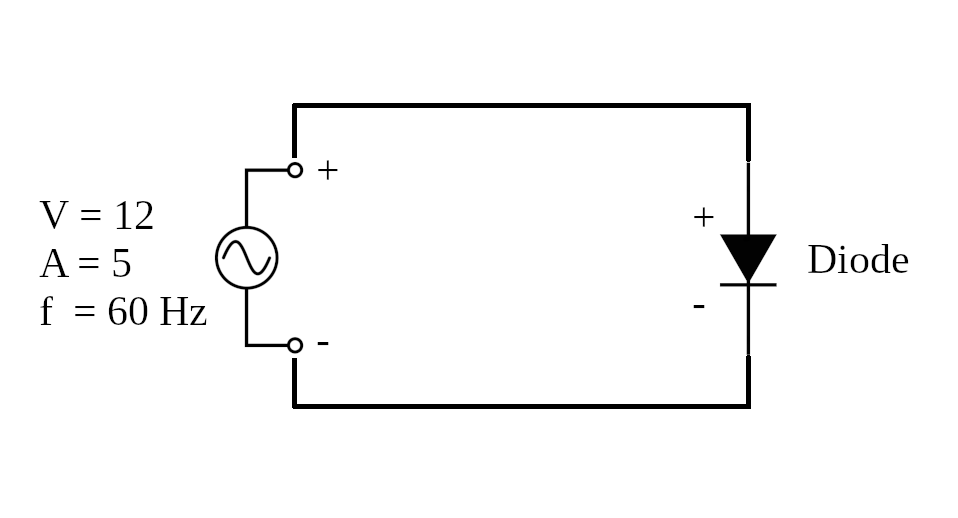
Diodes: I tested nine diodes using the same AC source but using a resistor rated 12 ohms and a maximum current of 100W.
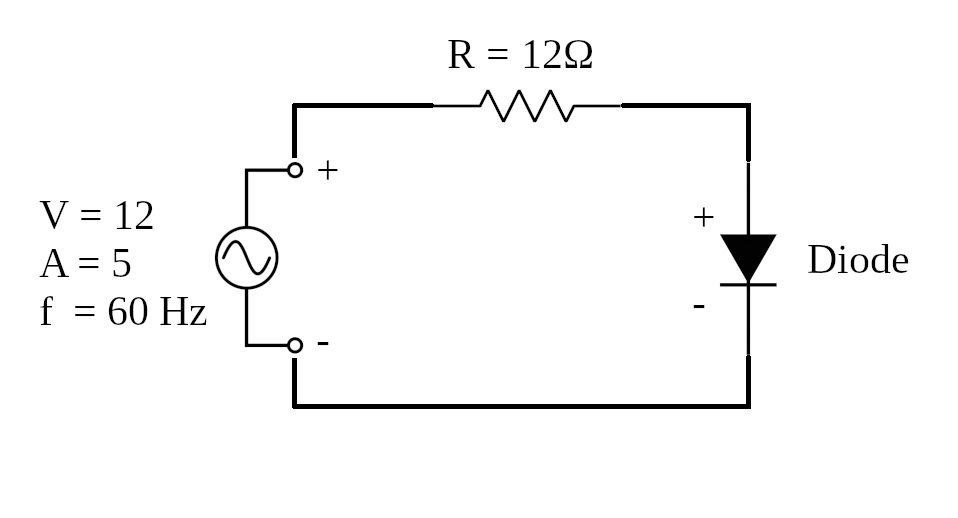
An alternating source (AC) is produced on the left to create a closed circuit. A 12 ohm resistor (load) is attached in series with each diode during testing.
Test Results: Resistor and Diode
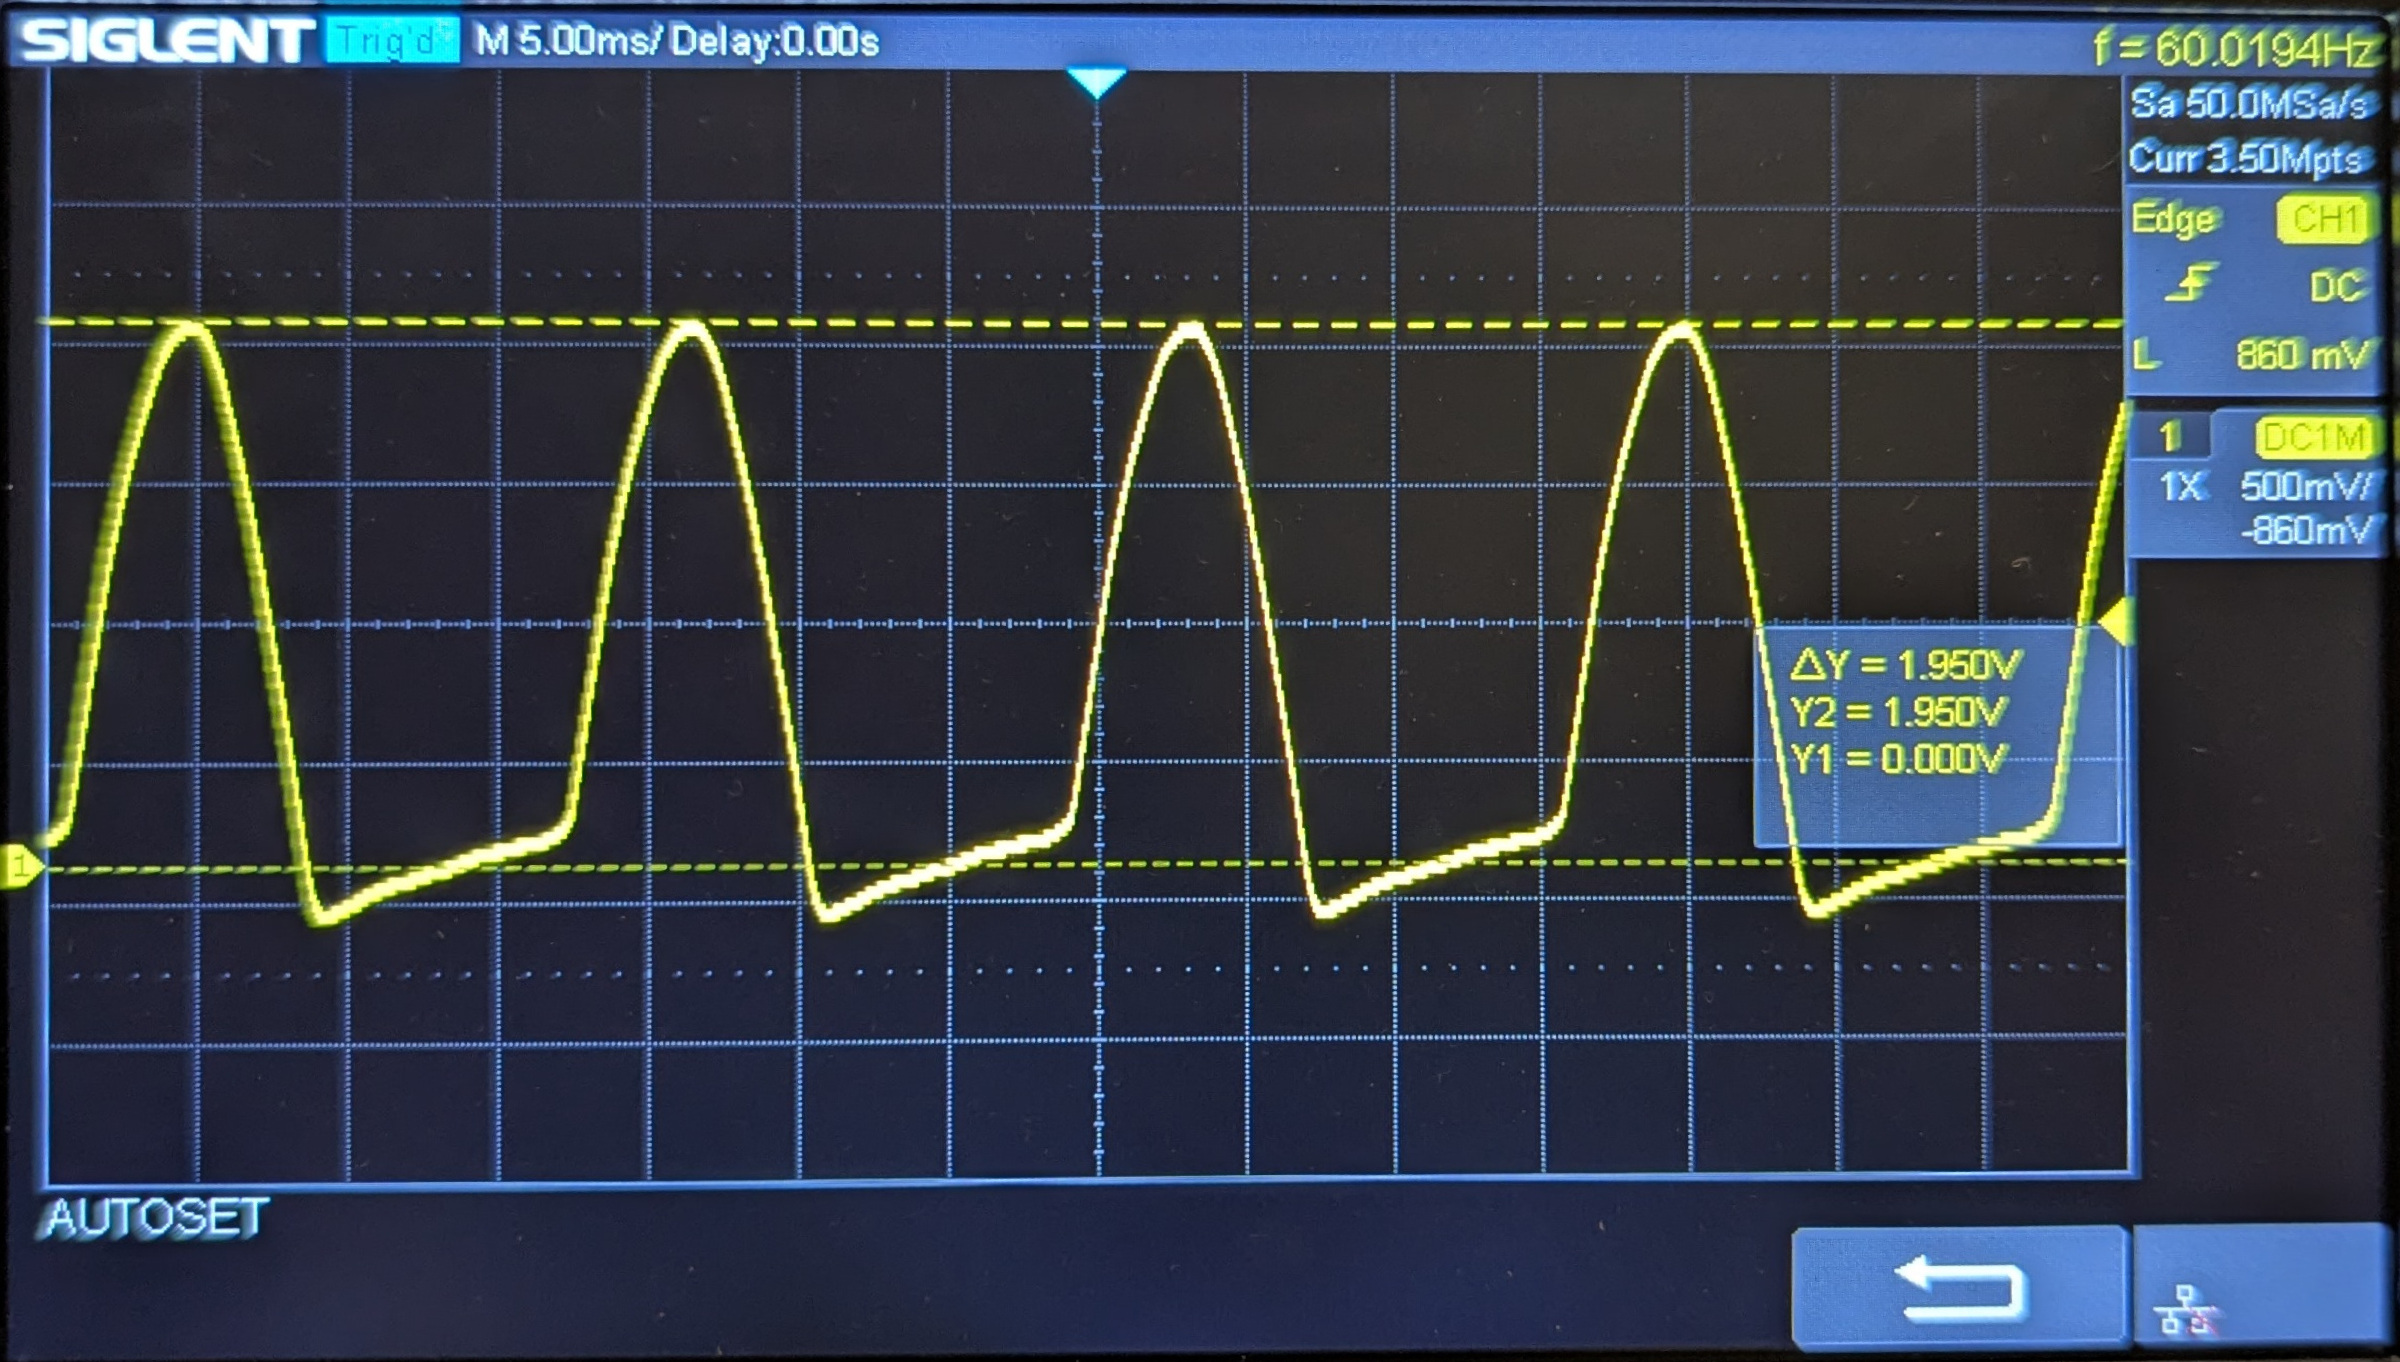
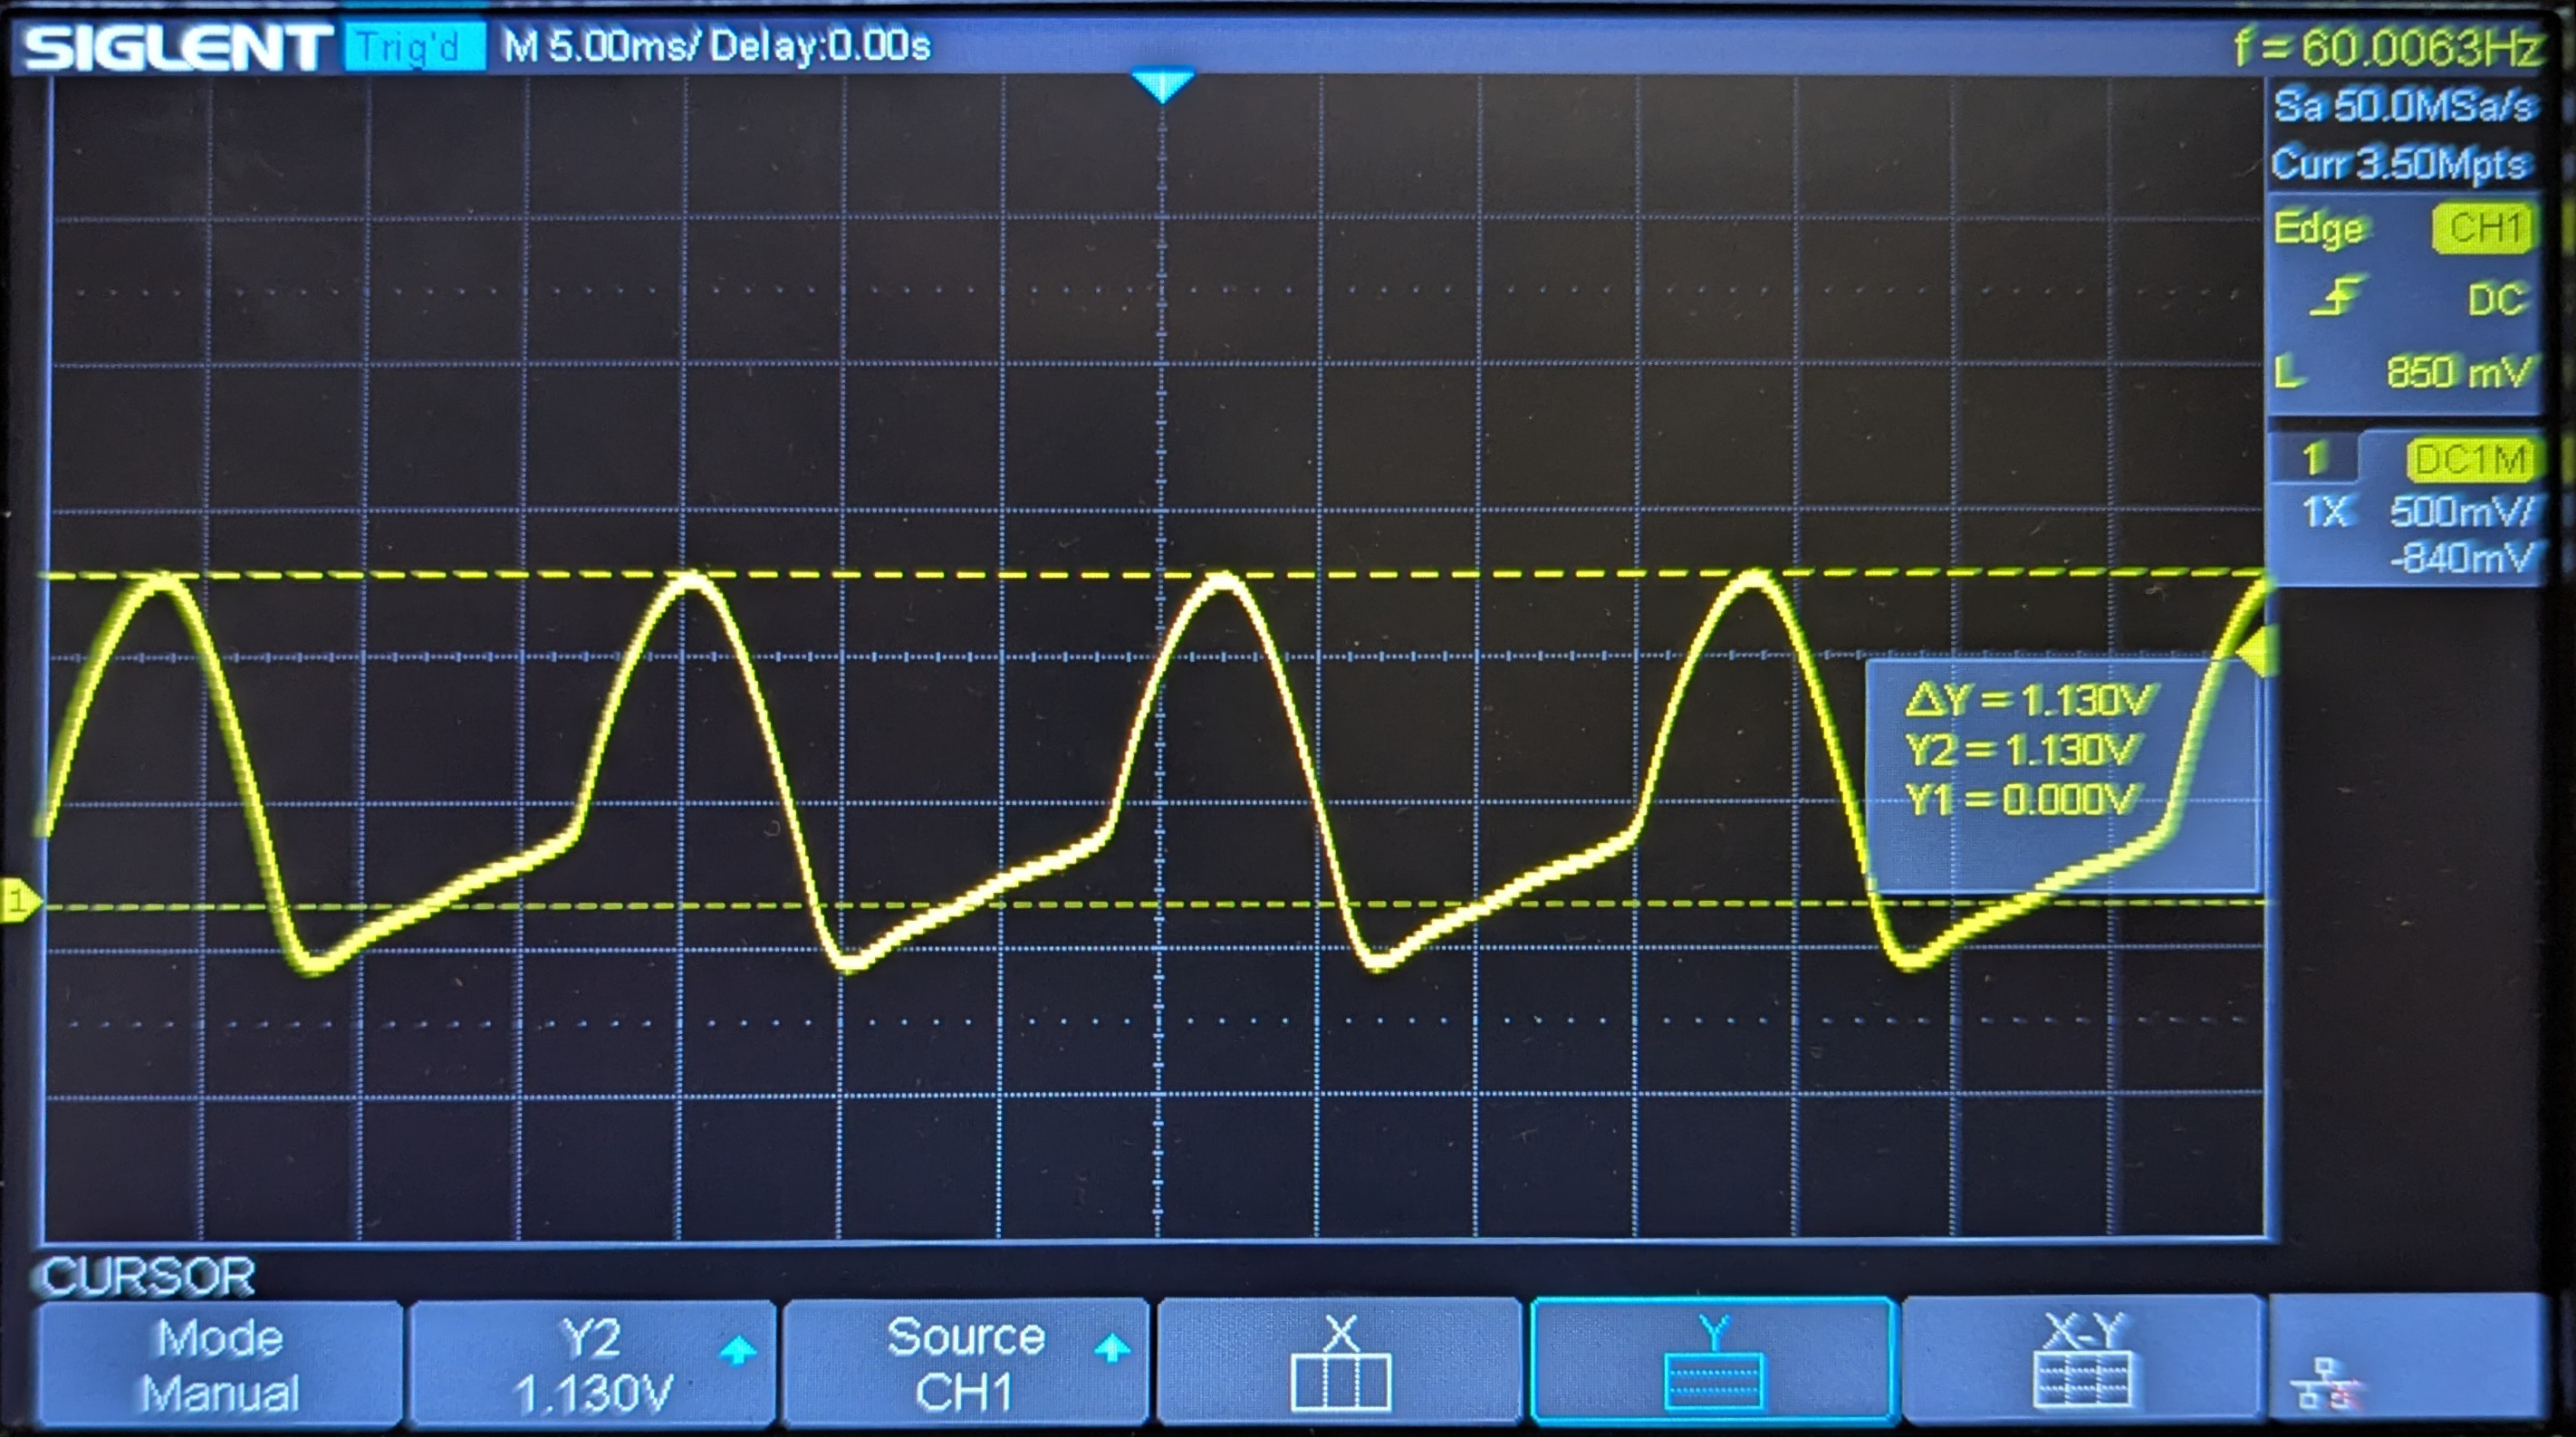
 1N4001 |
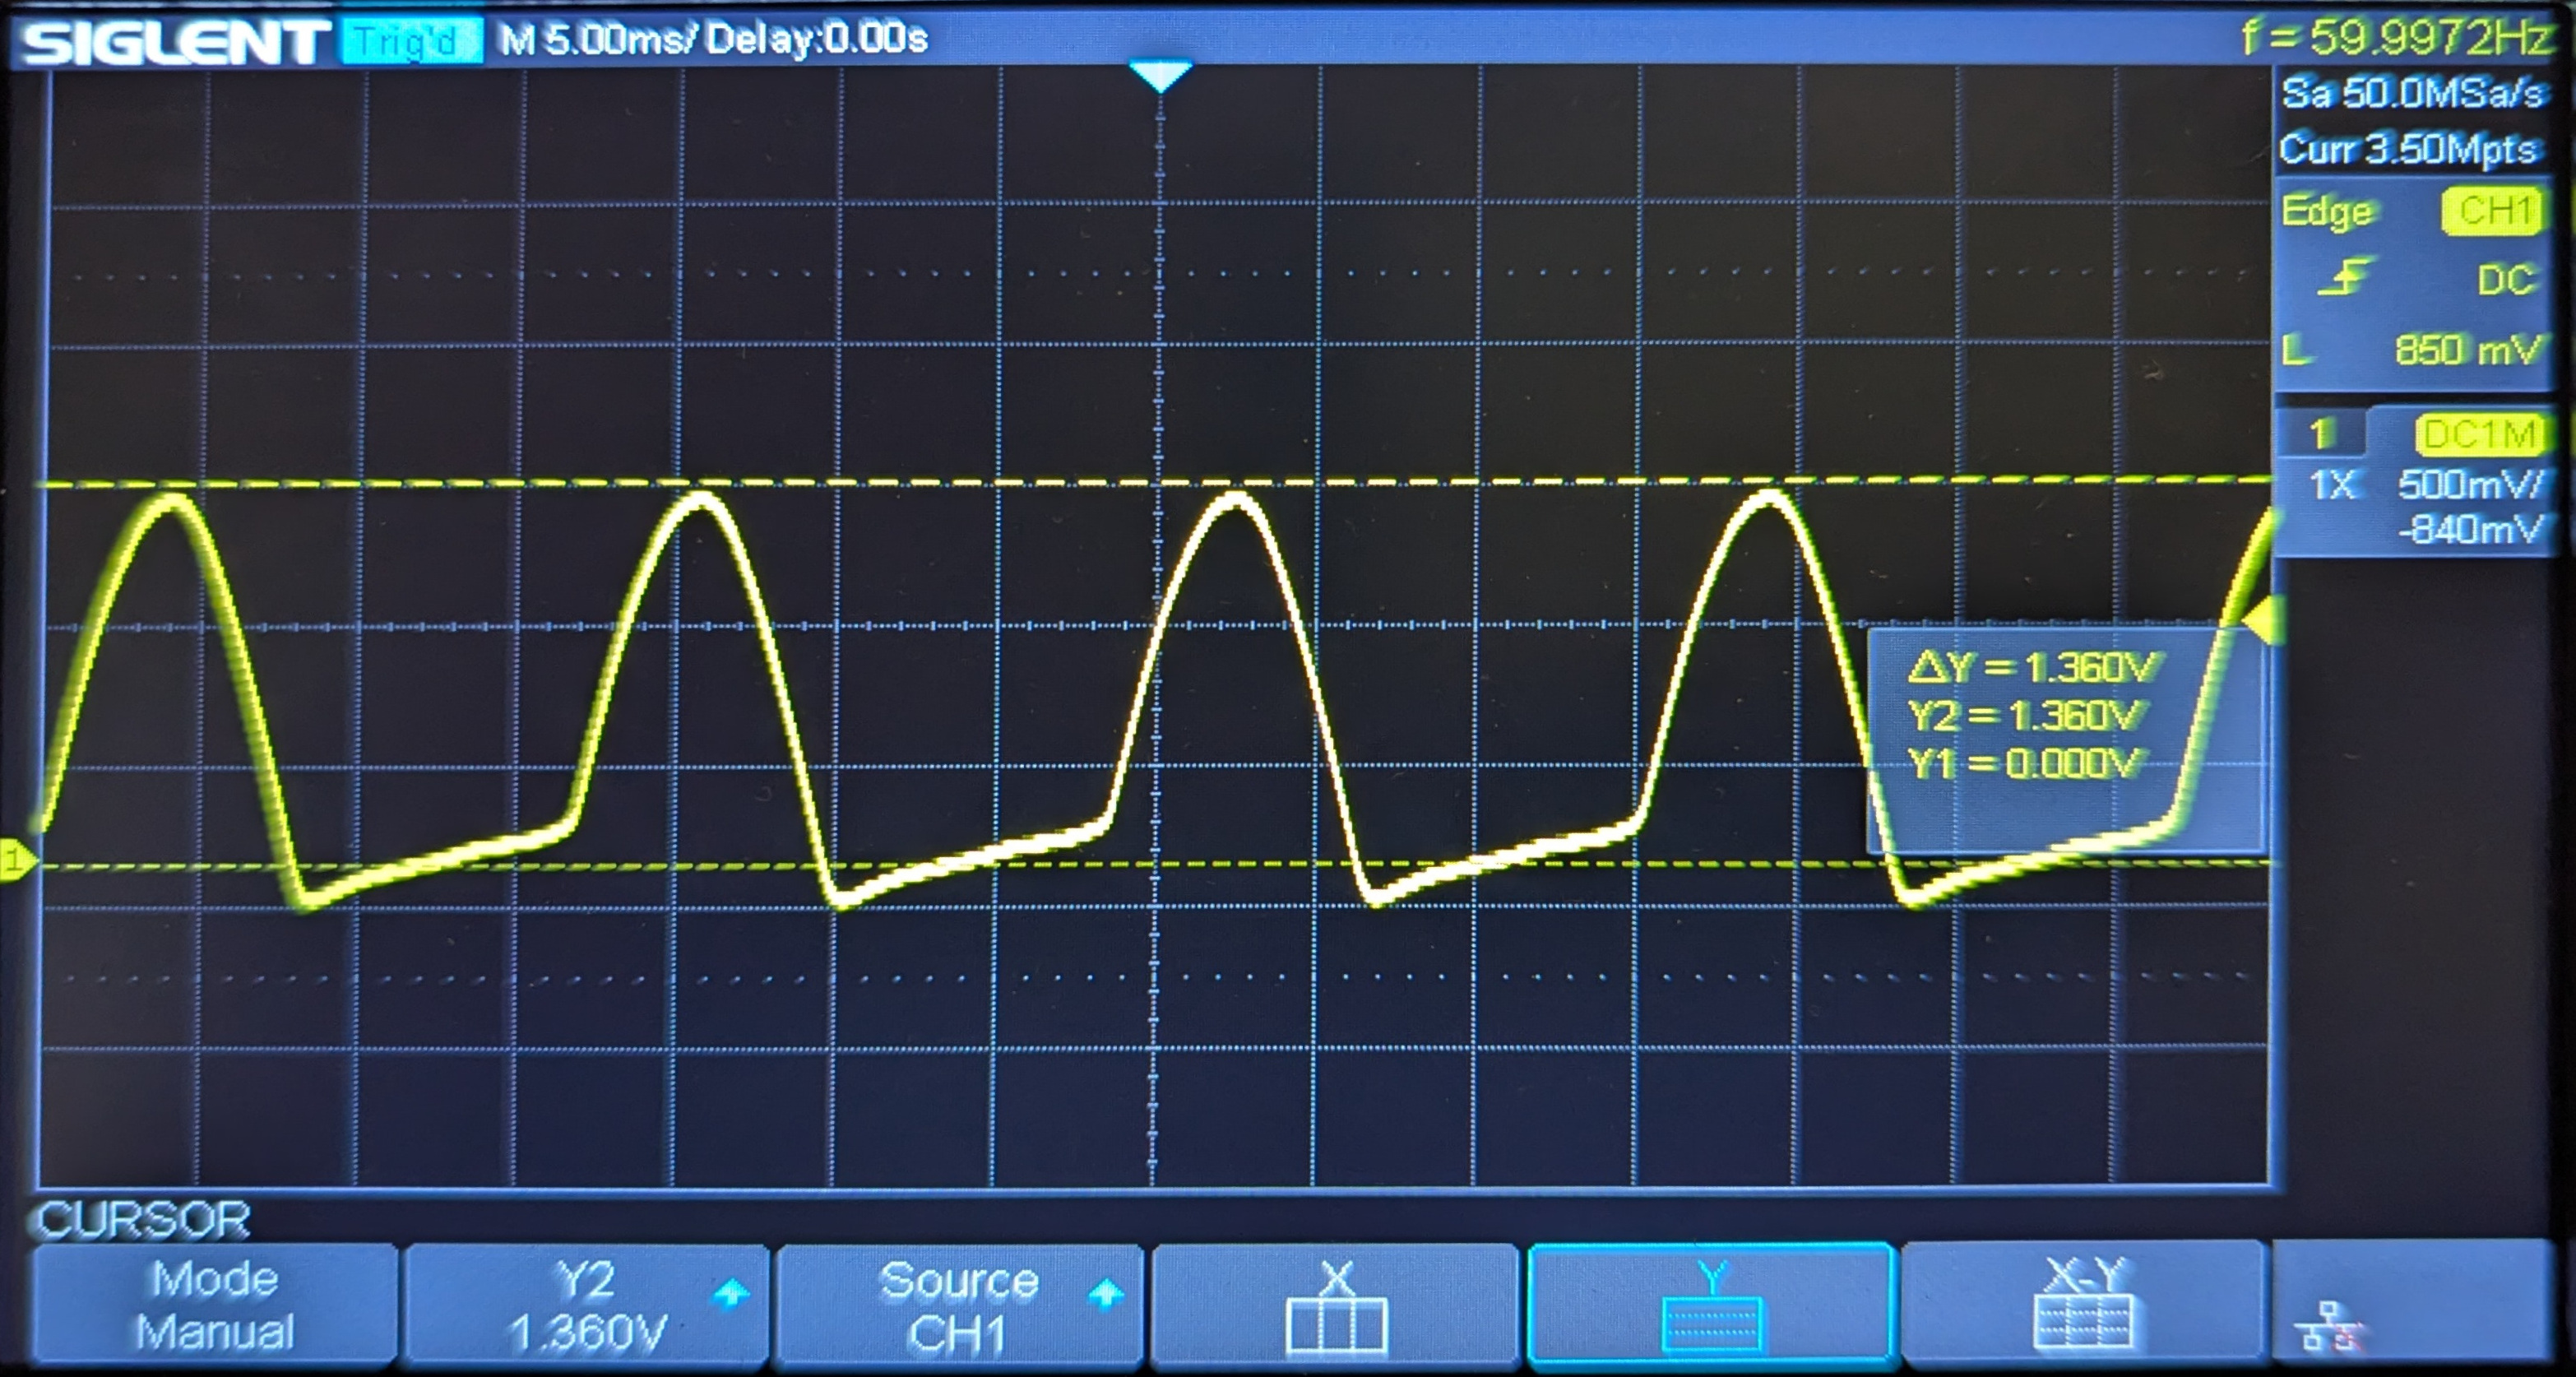
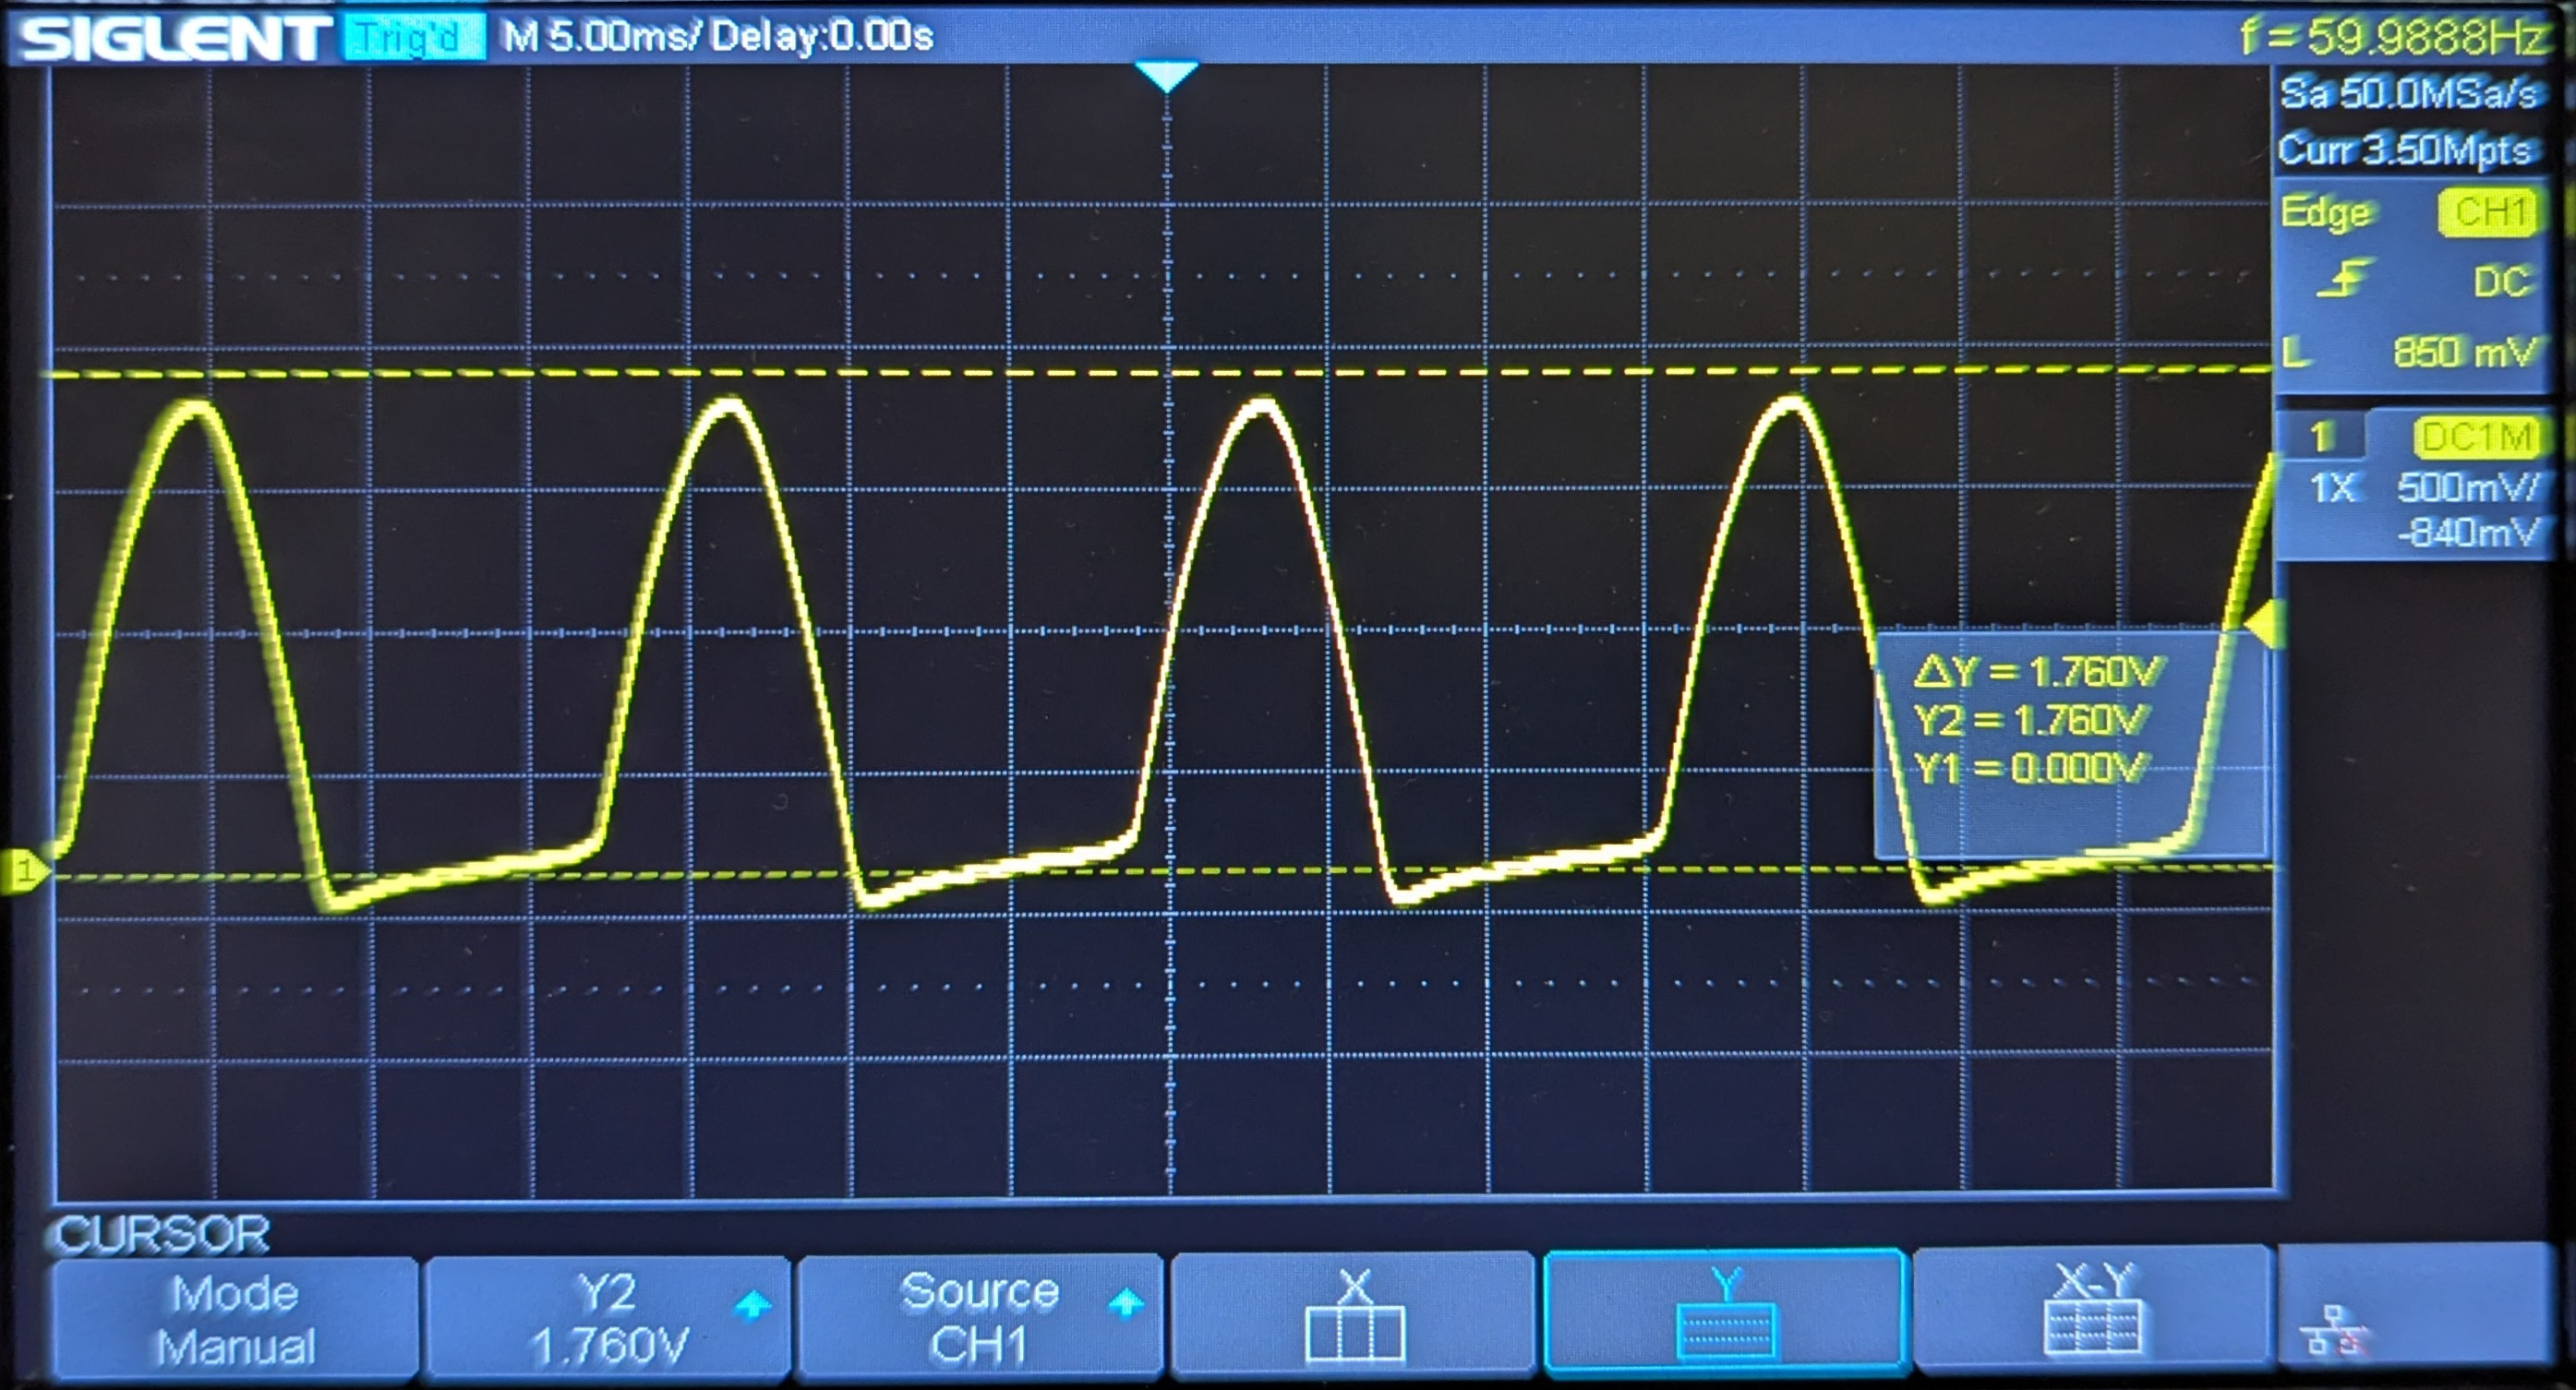 1N4004 |
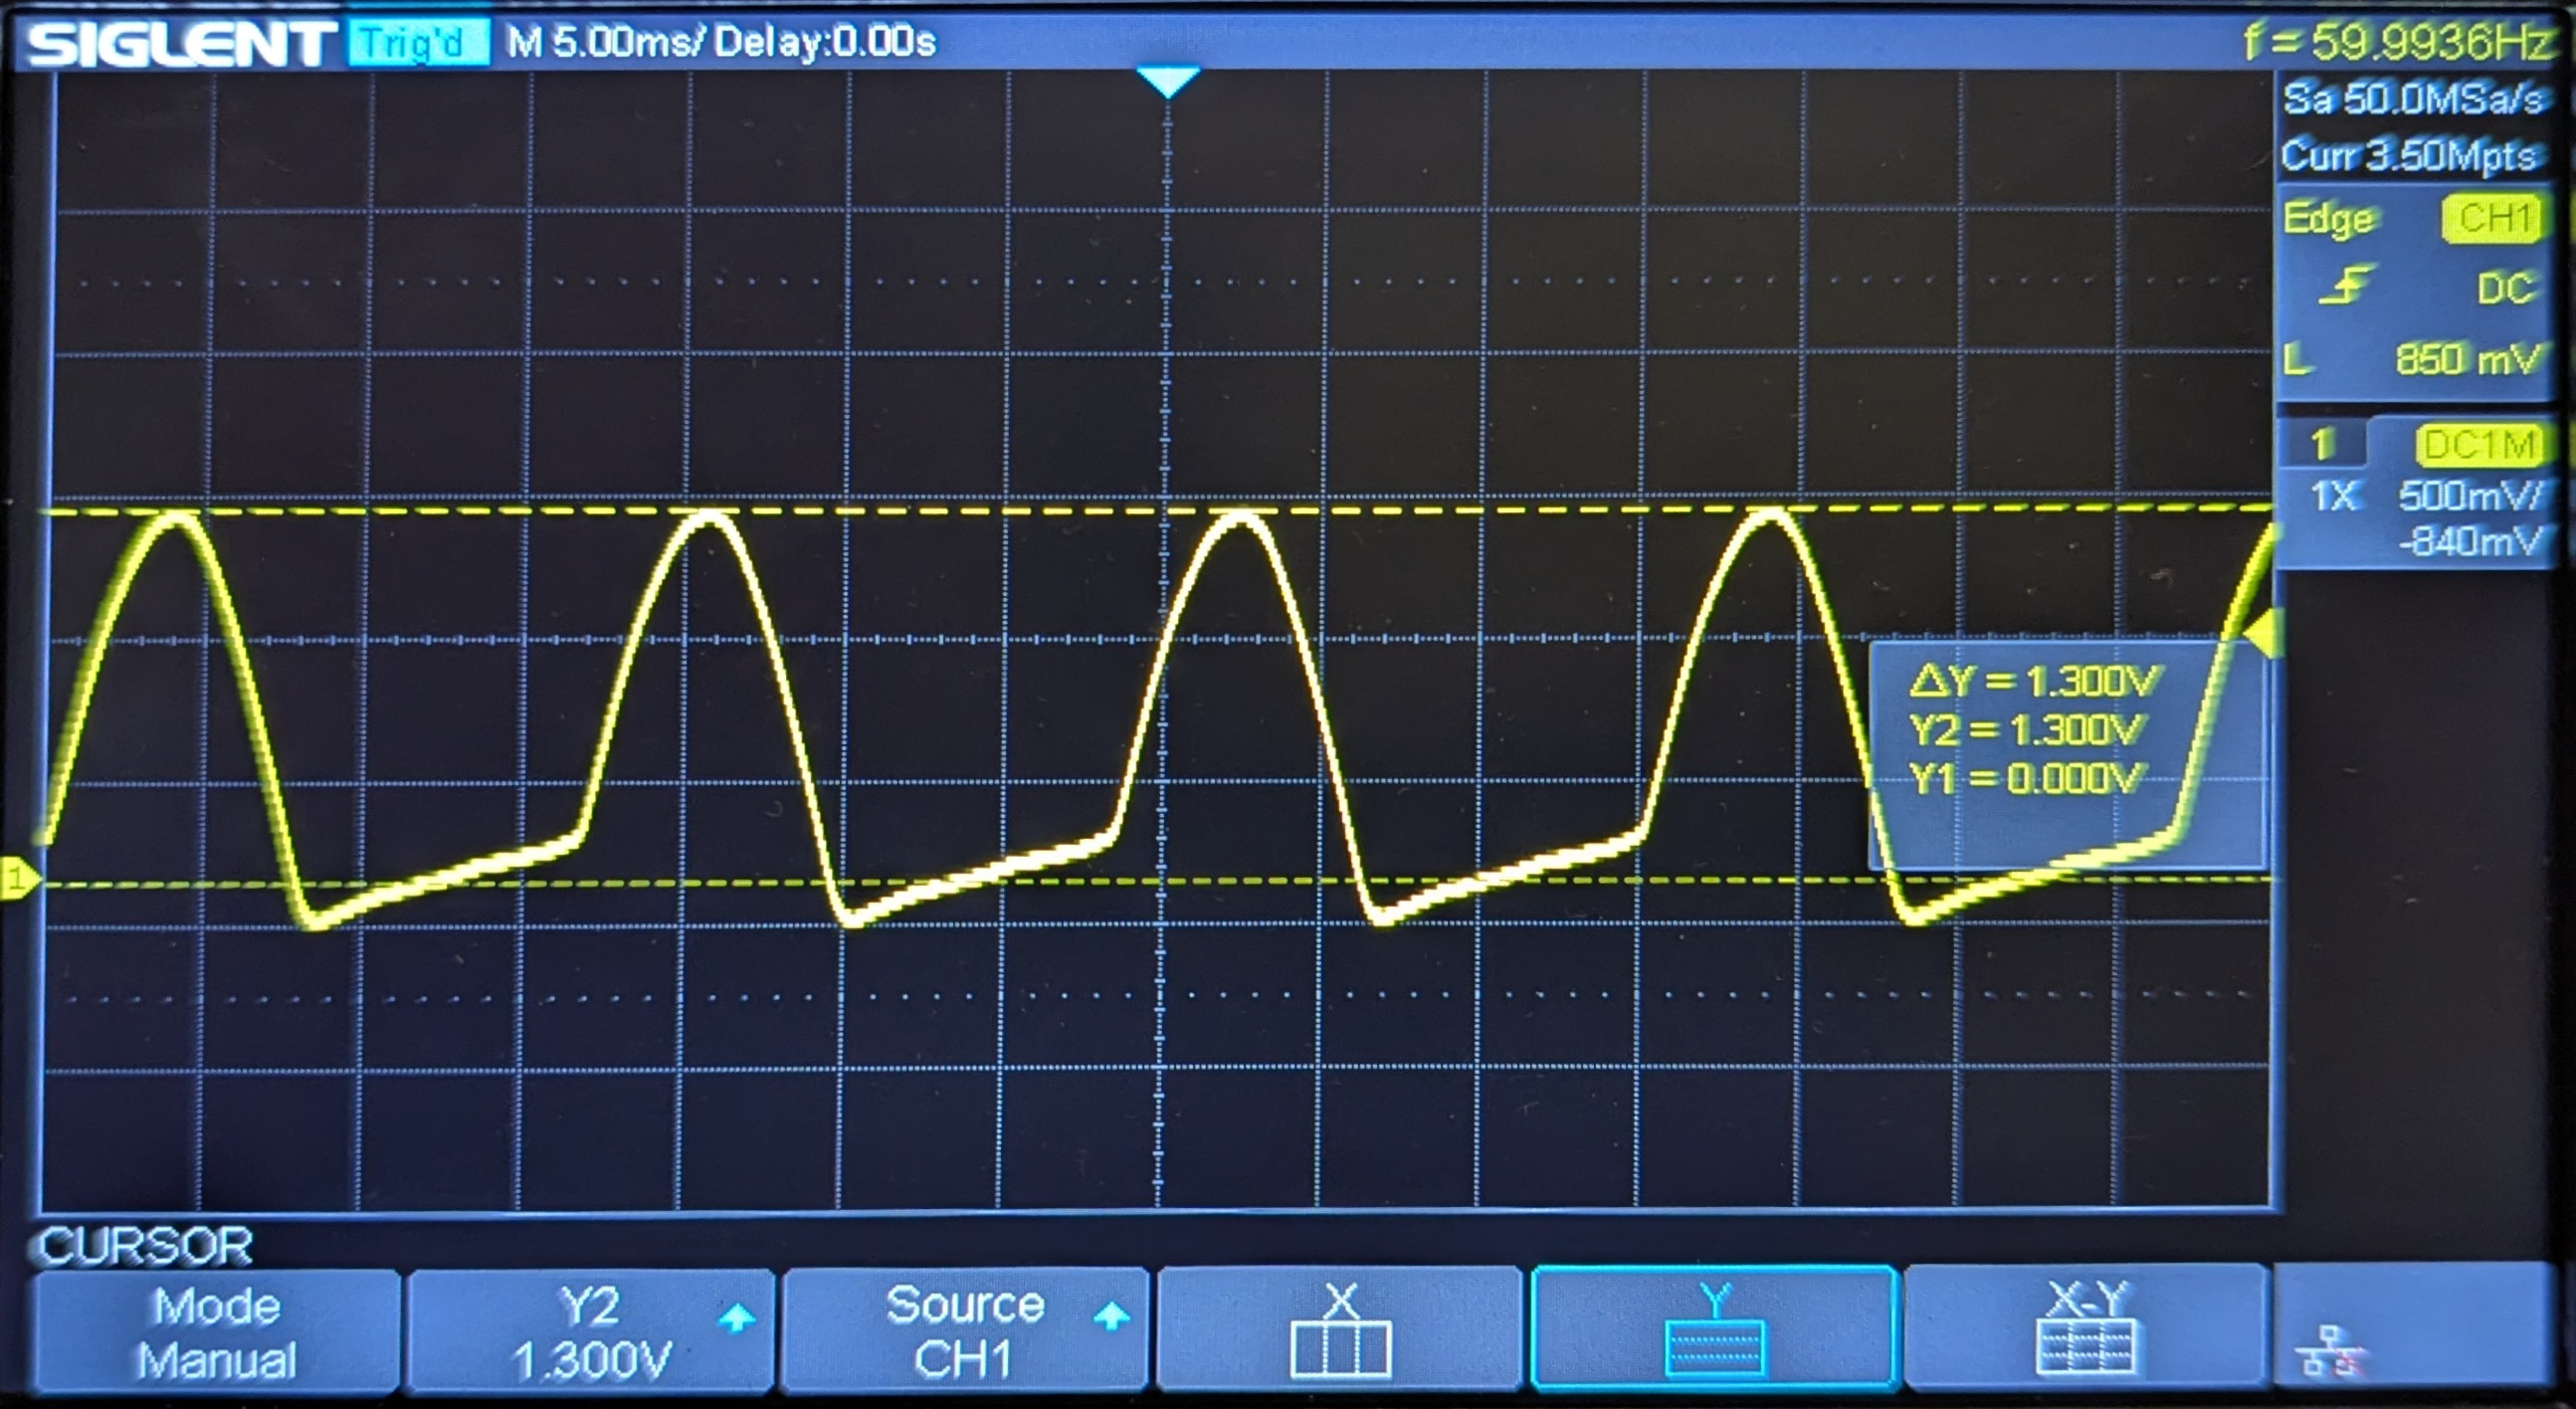
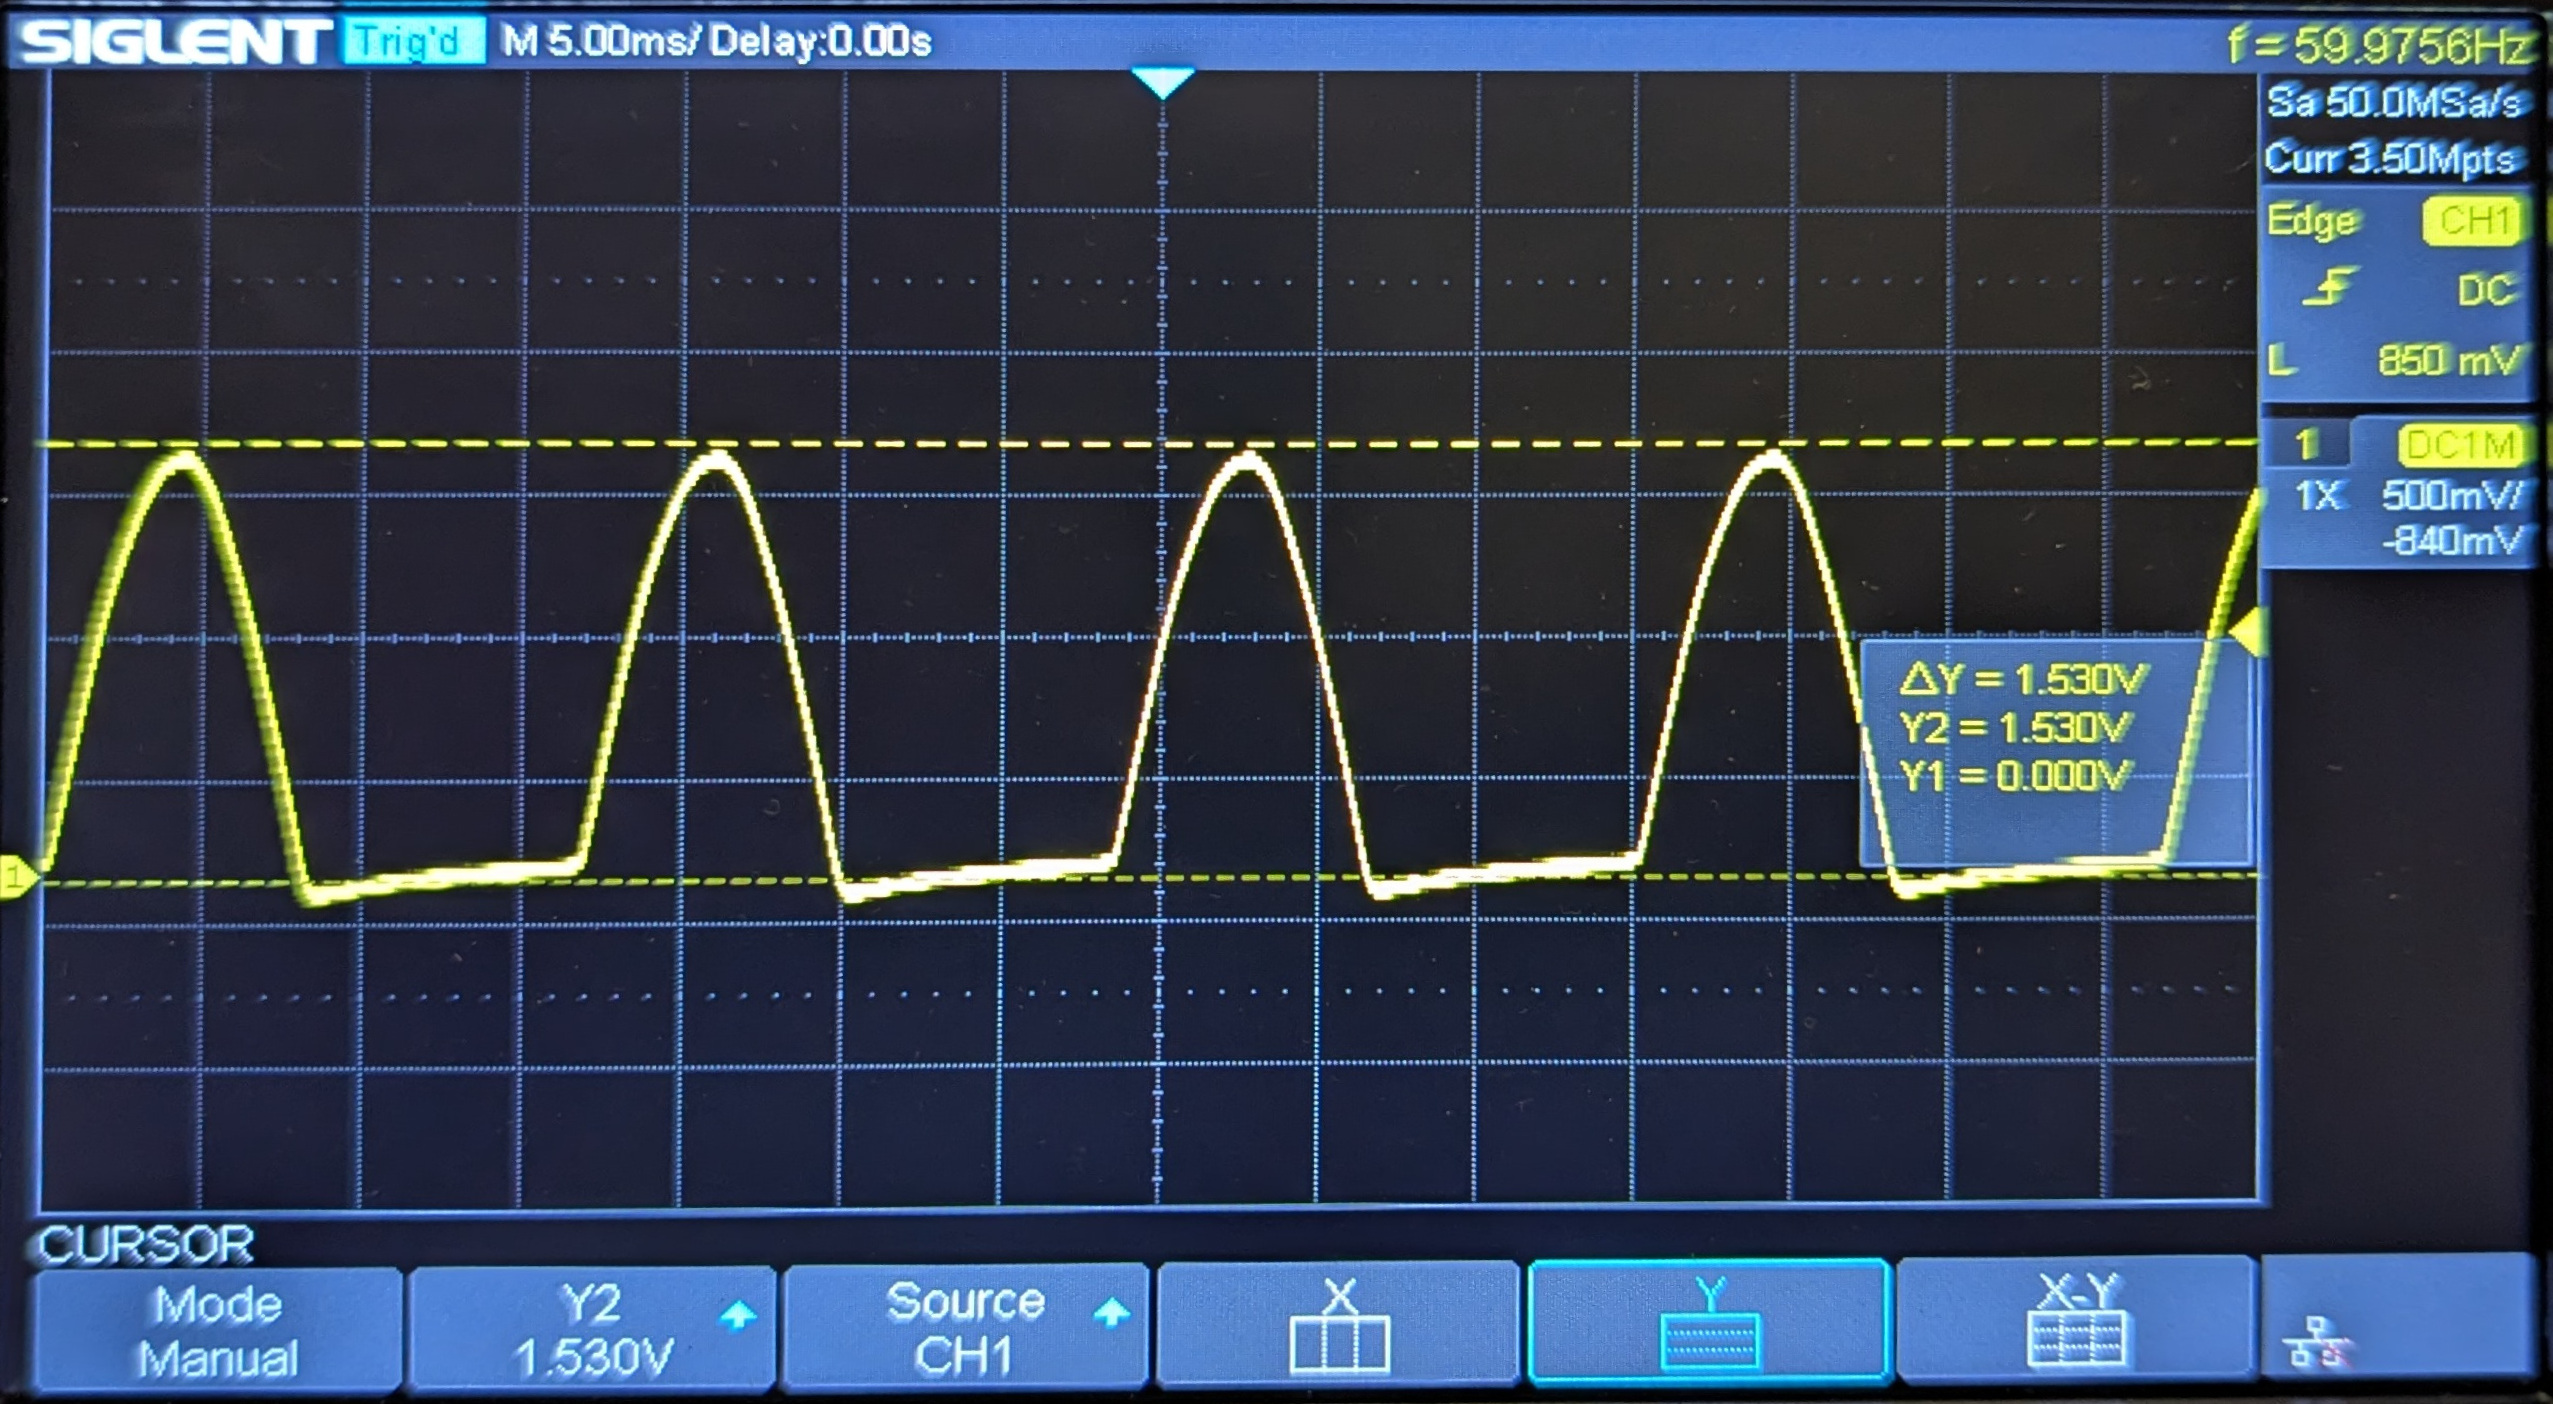 1N4007 |
 1N5404 |
 1N5406 |
 1N5408 |
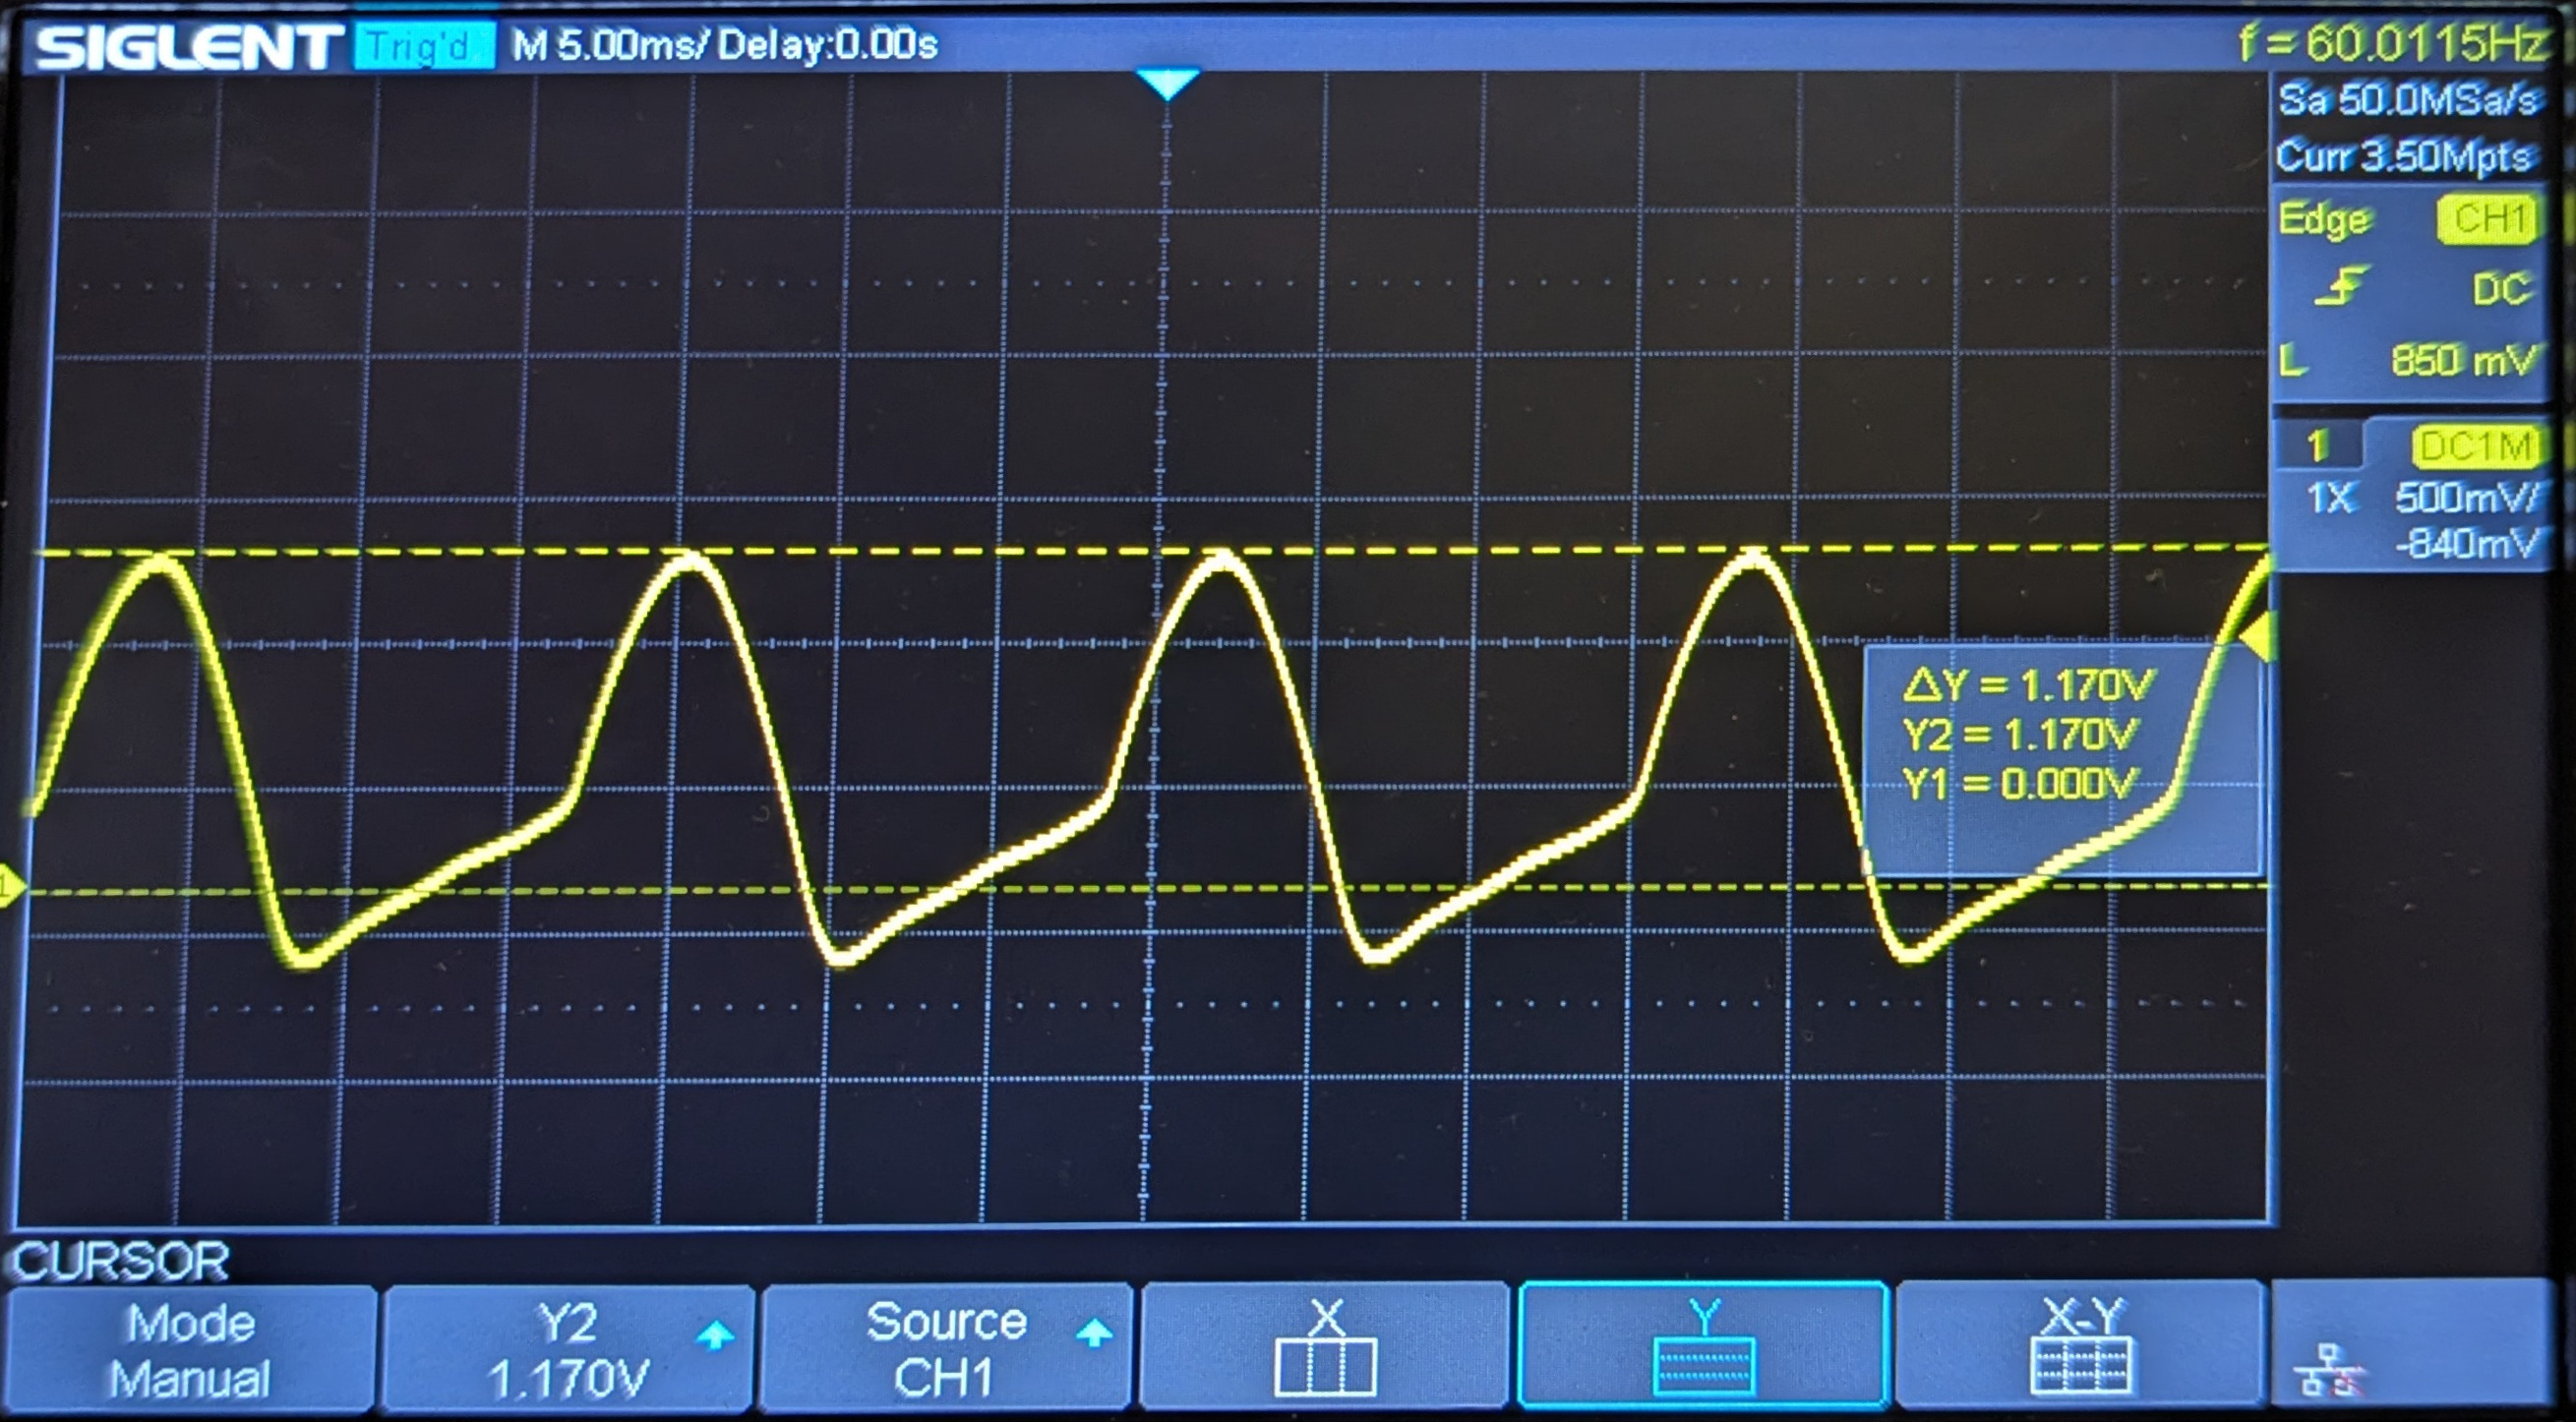 6A10 |
 10A10 |
 20A10 |
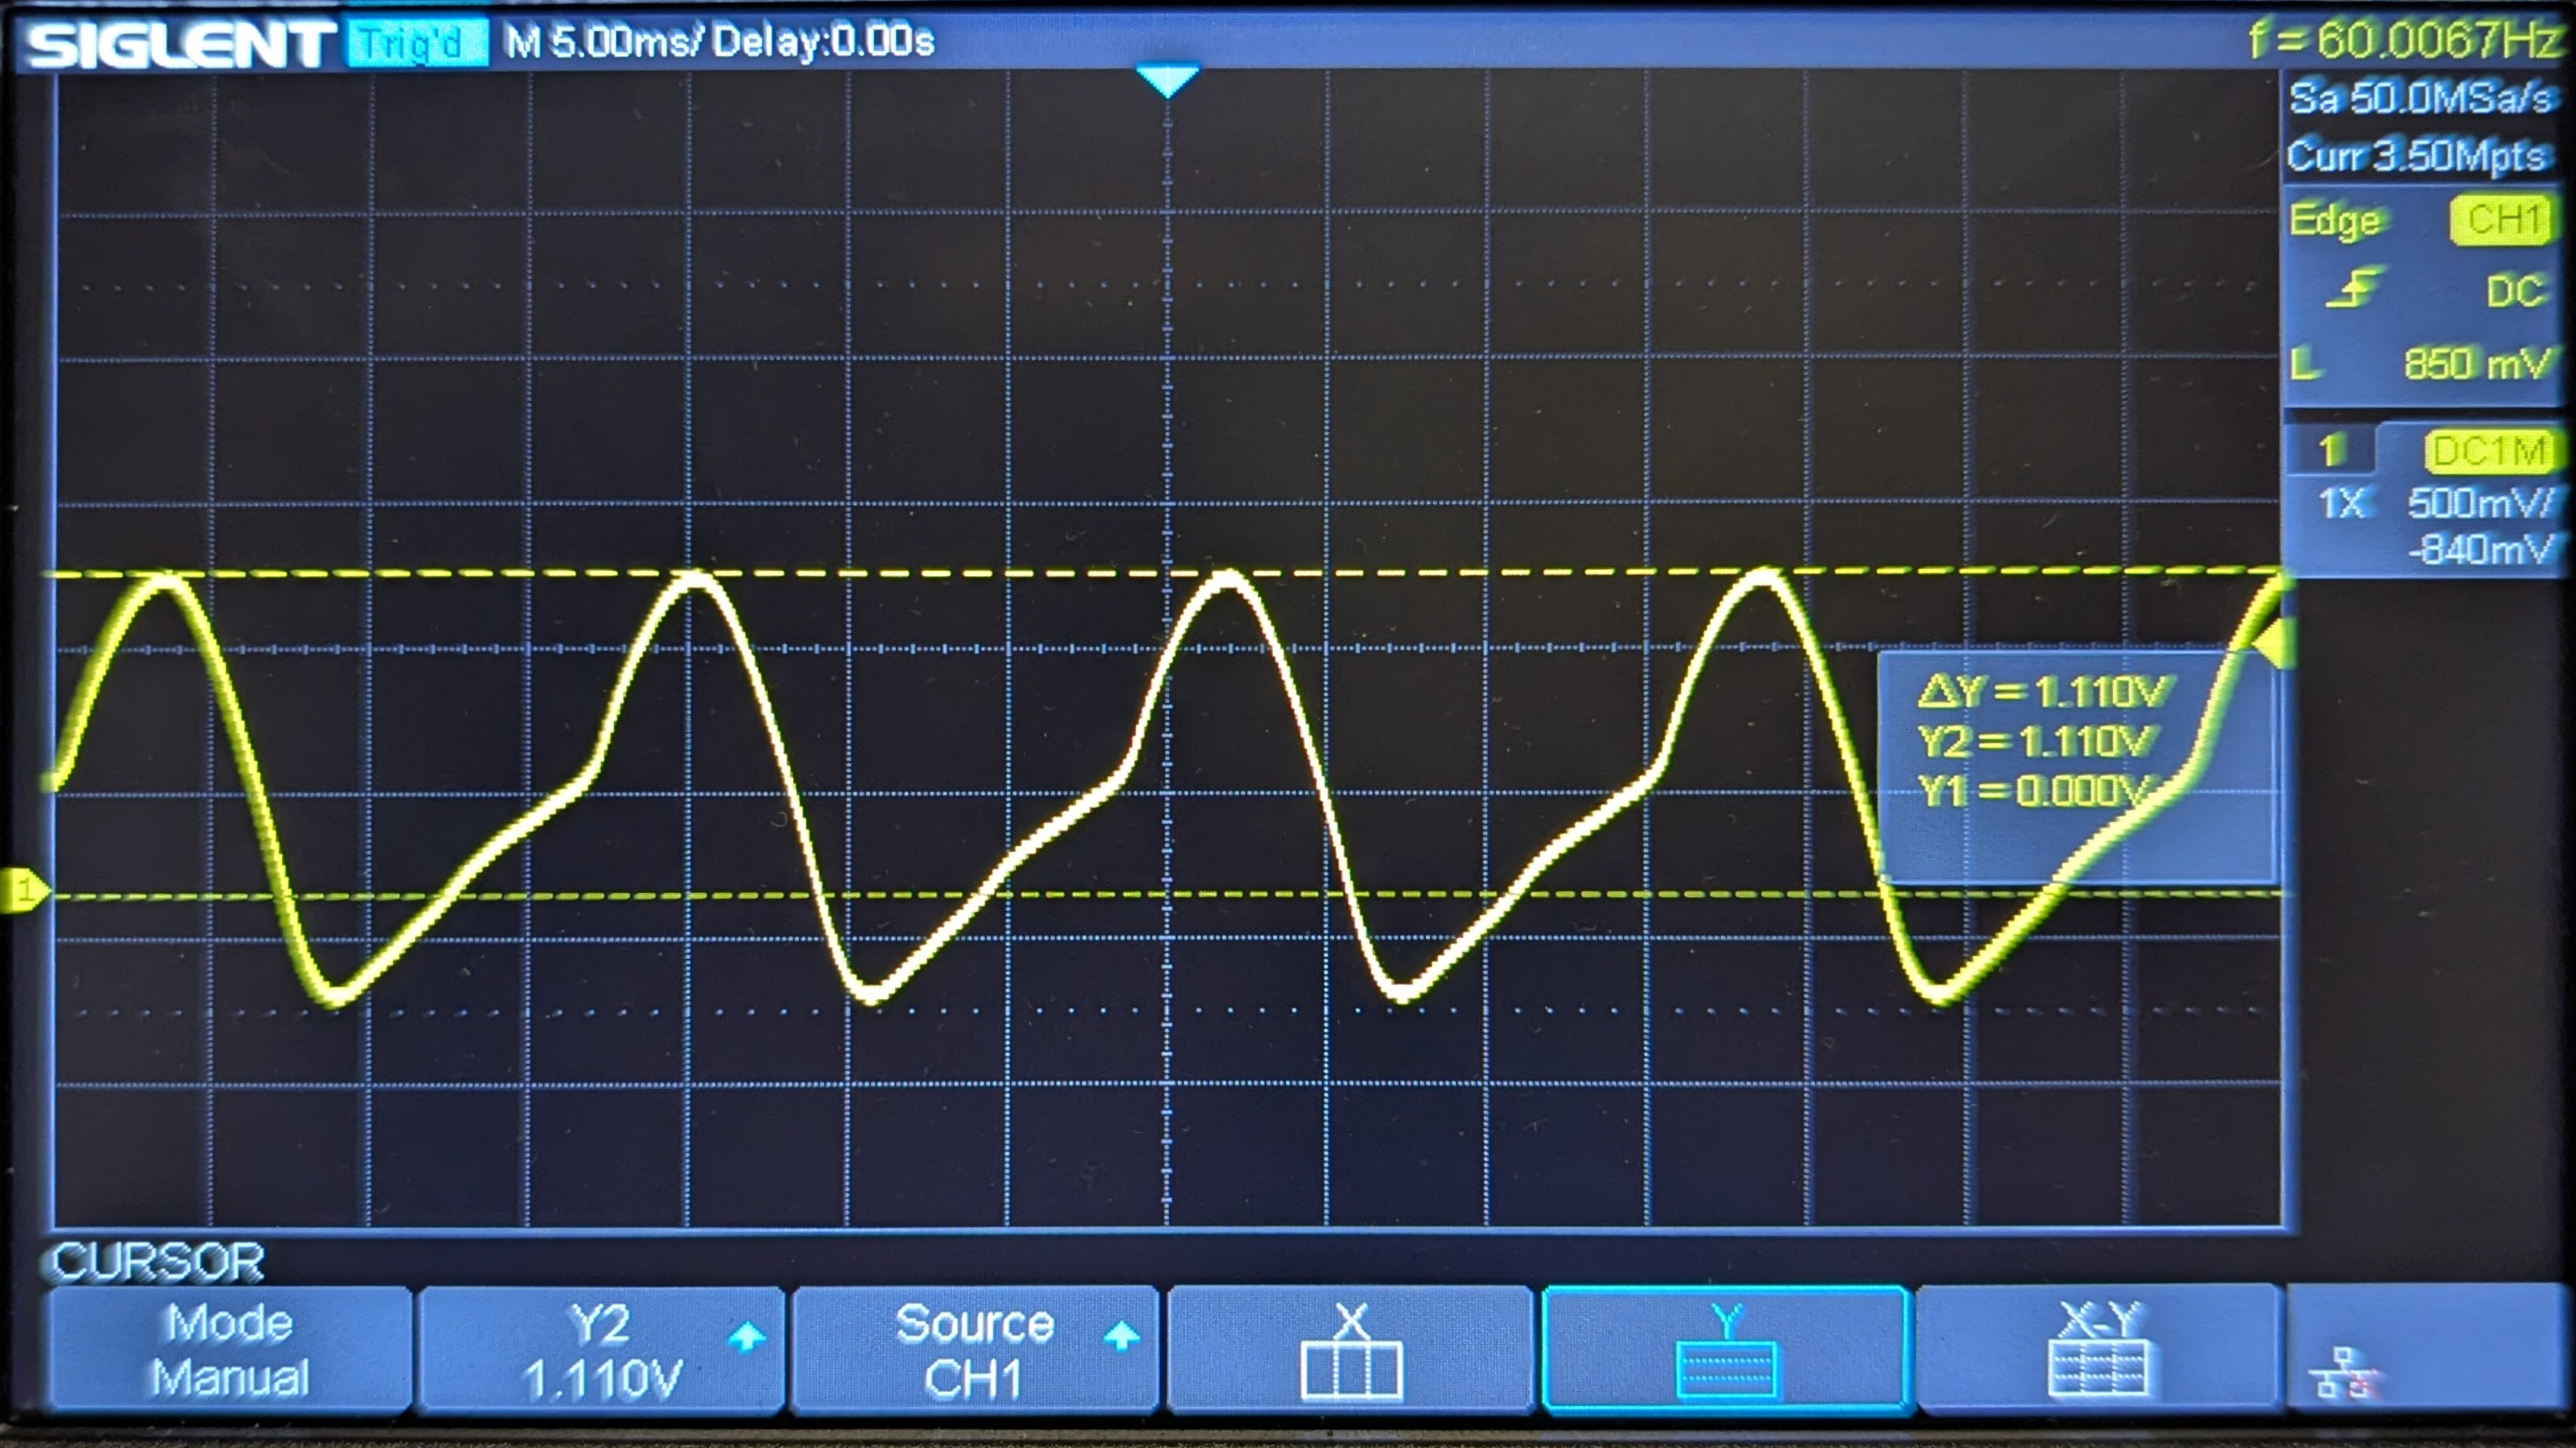
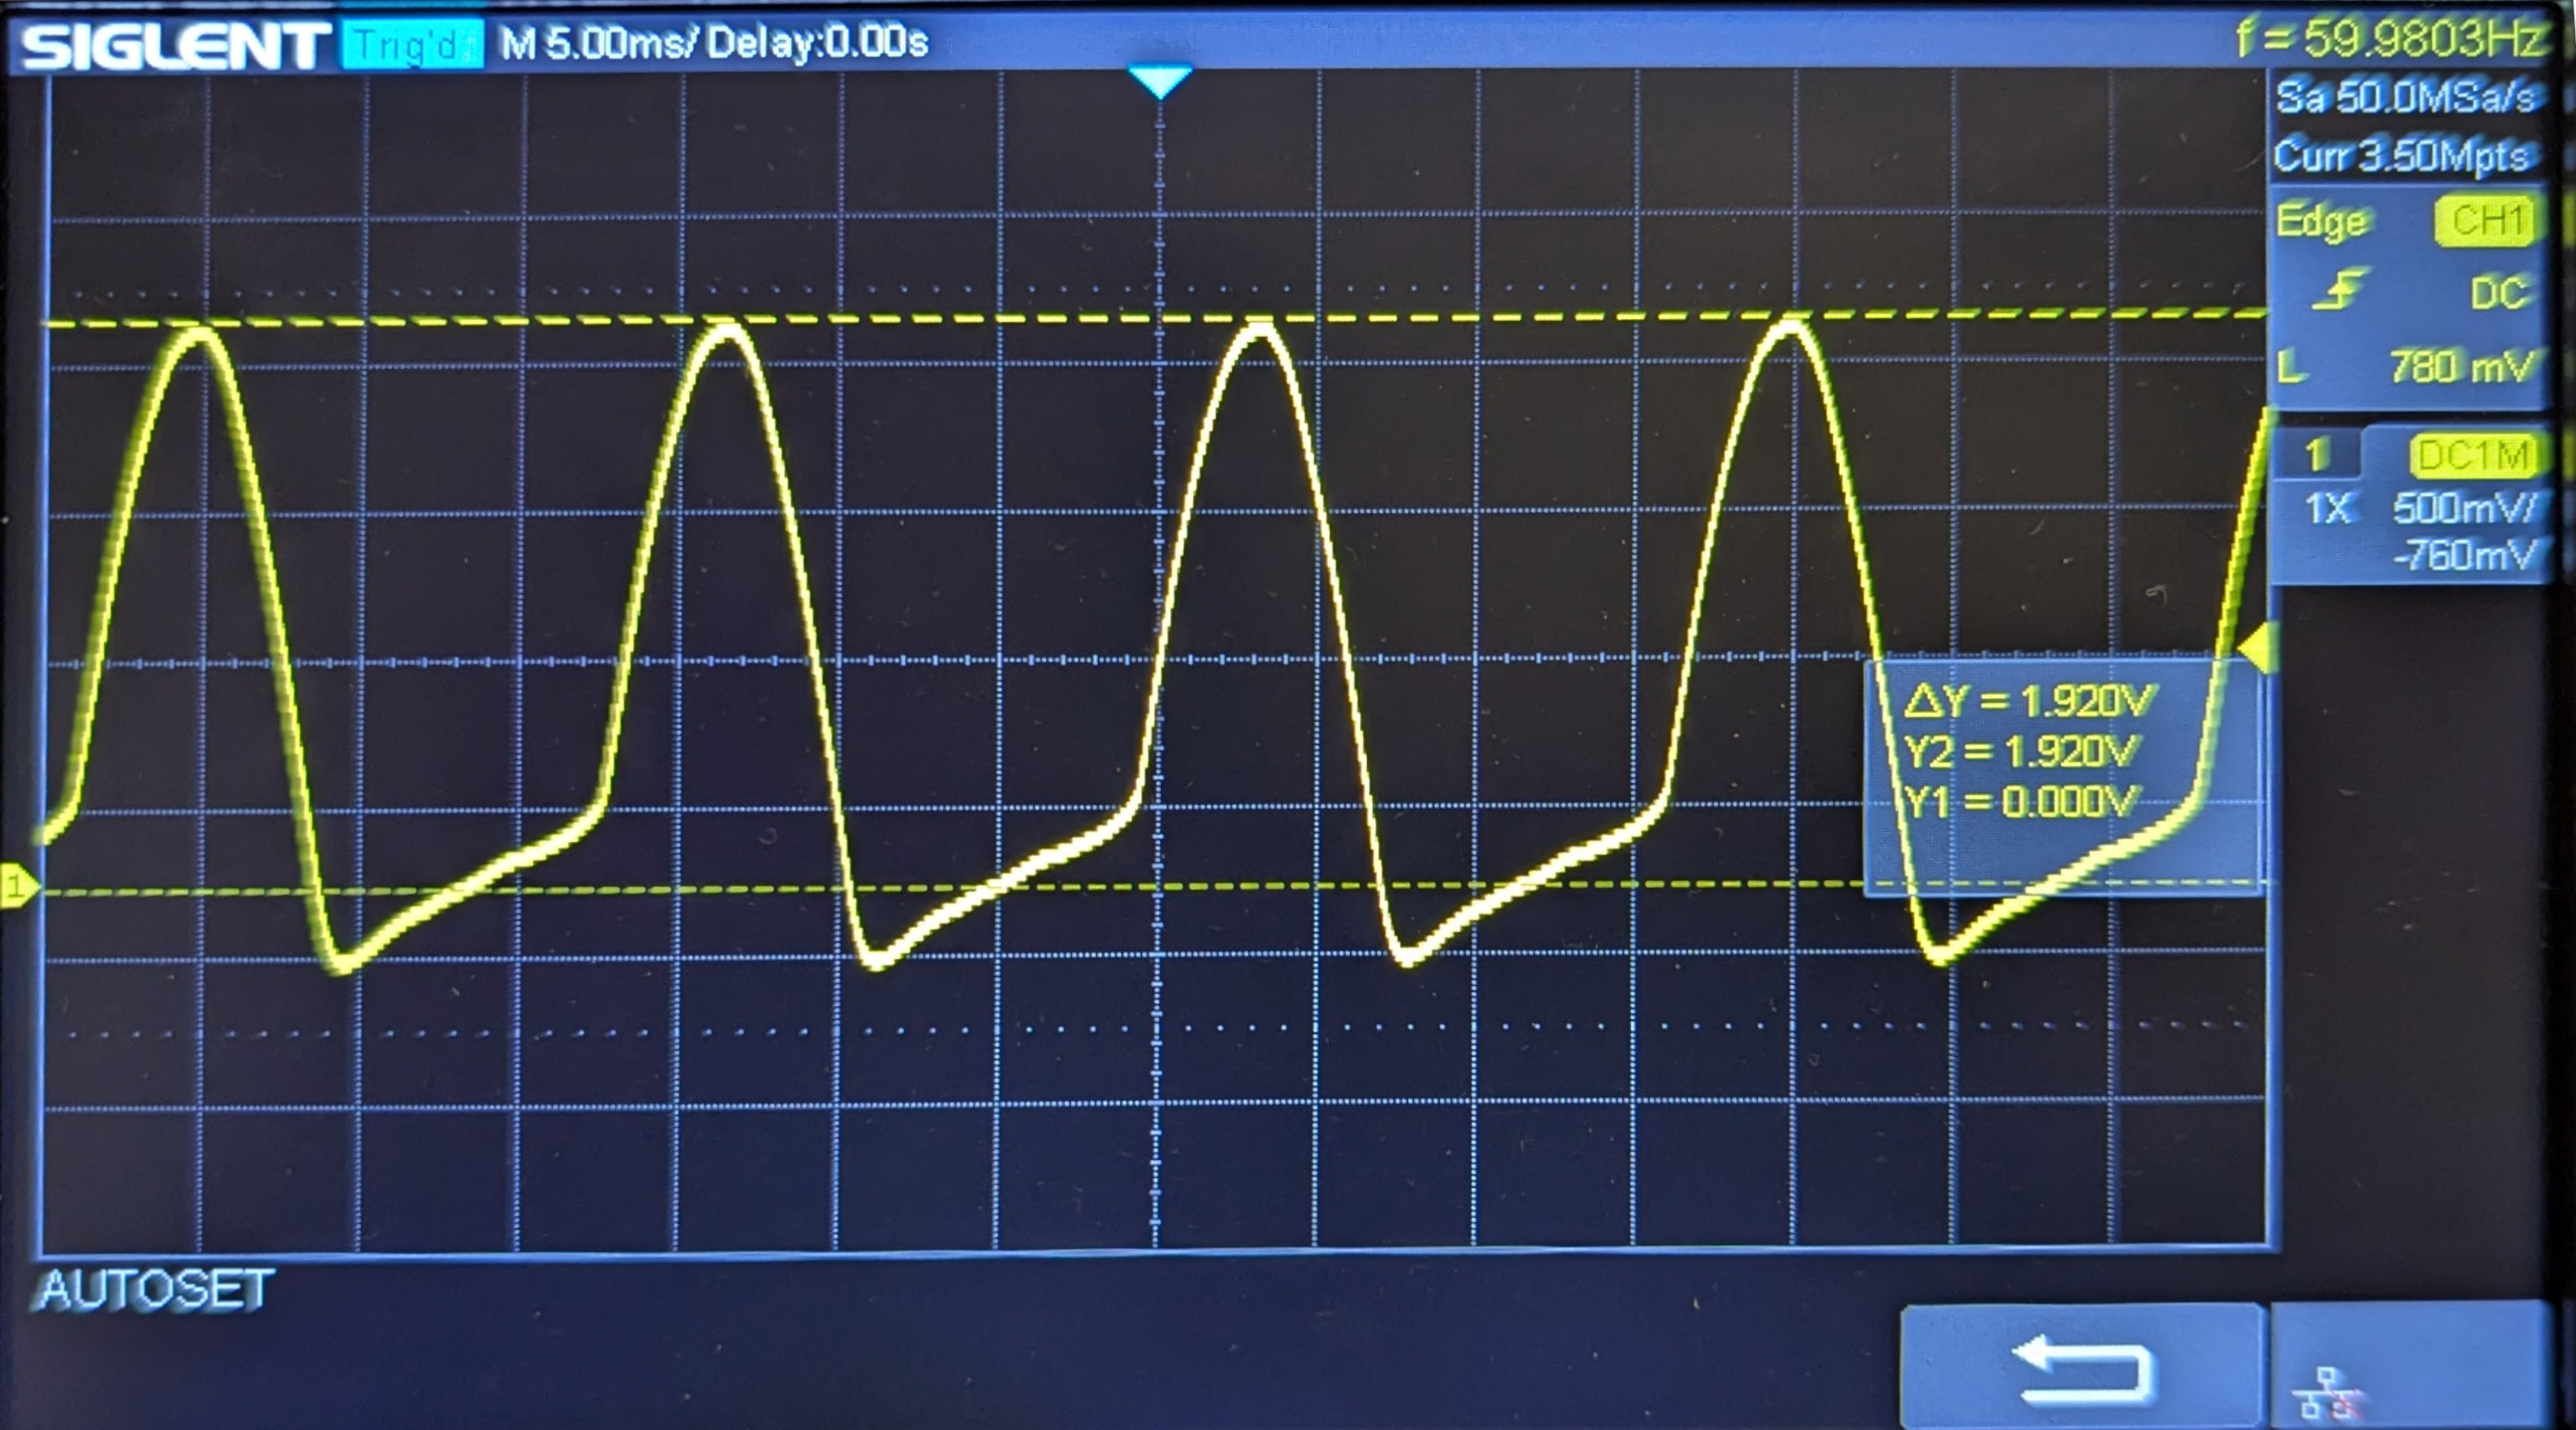
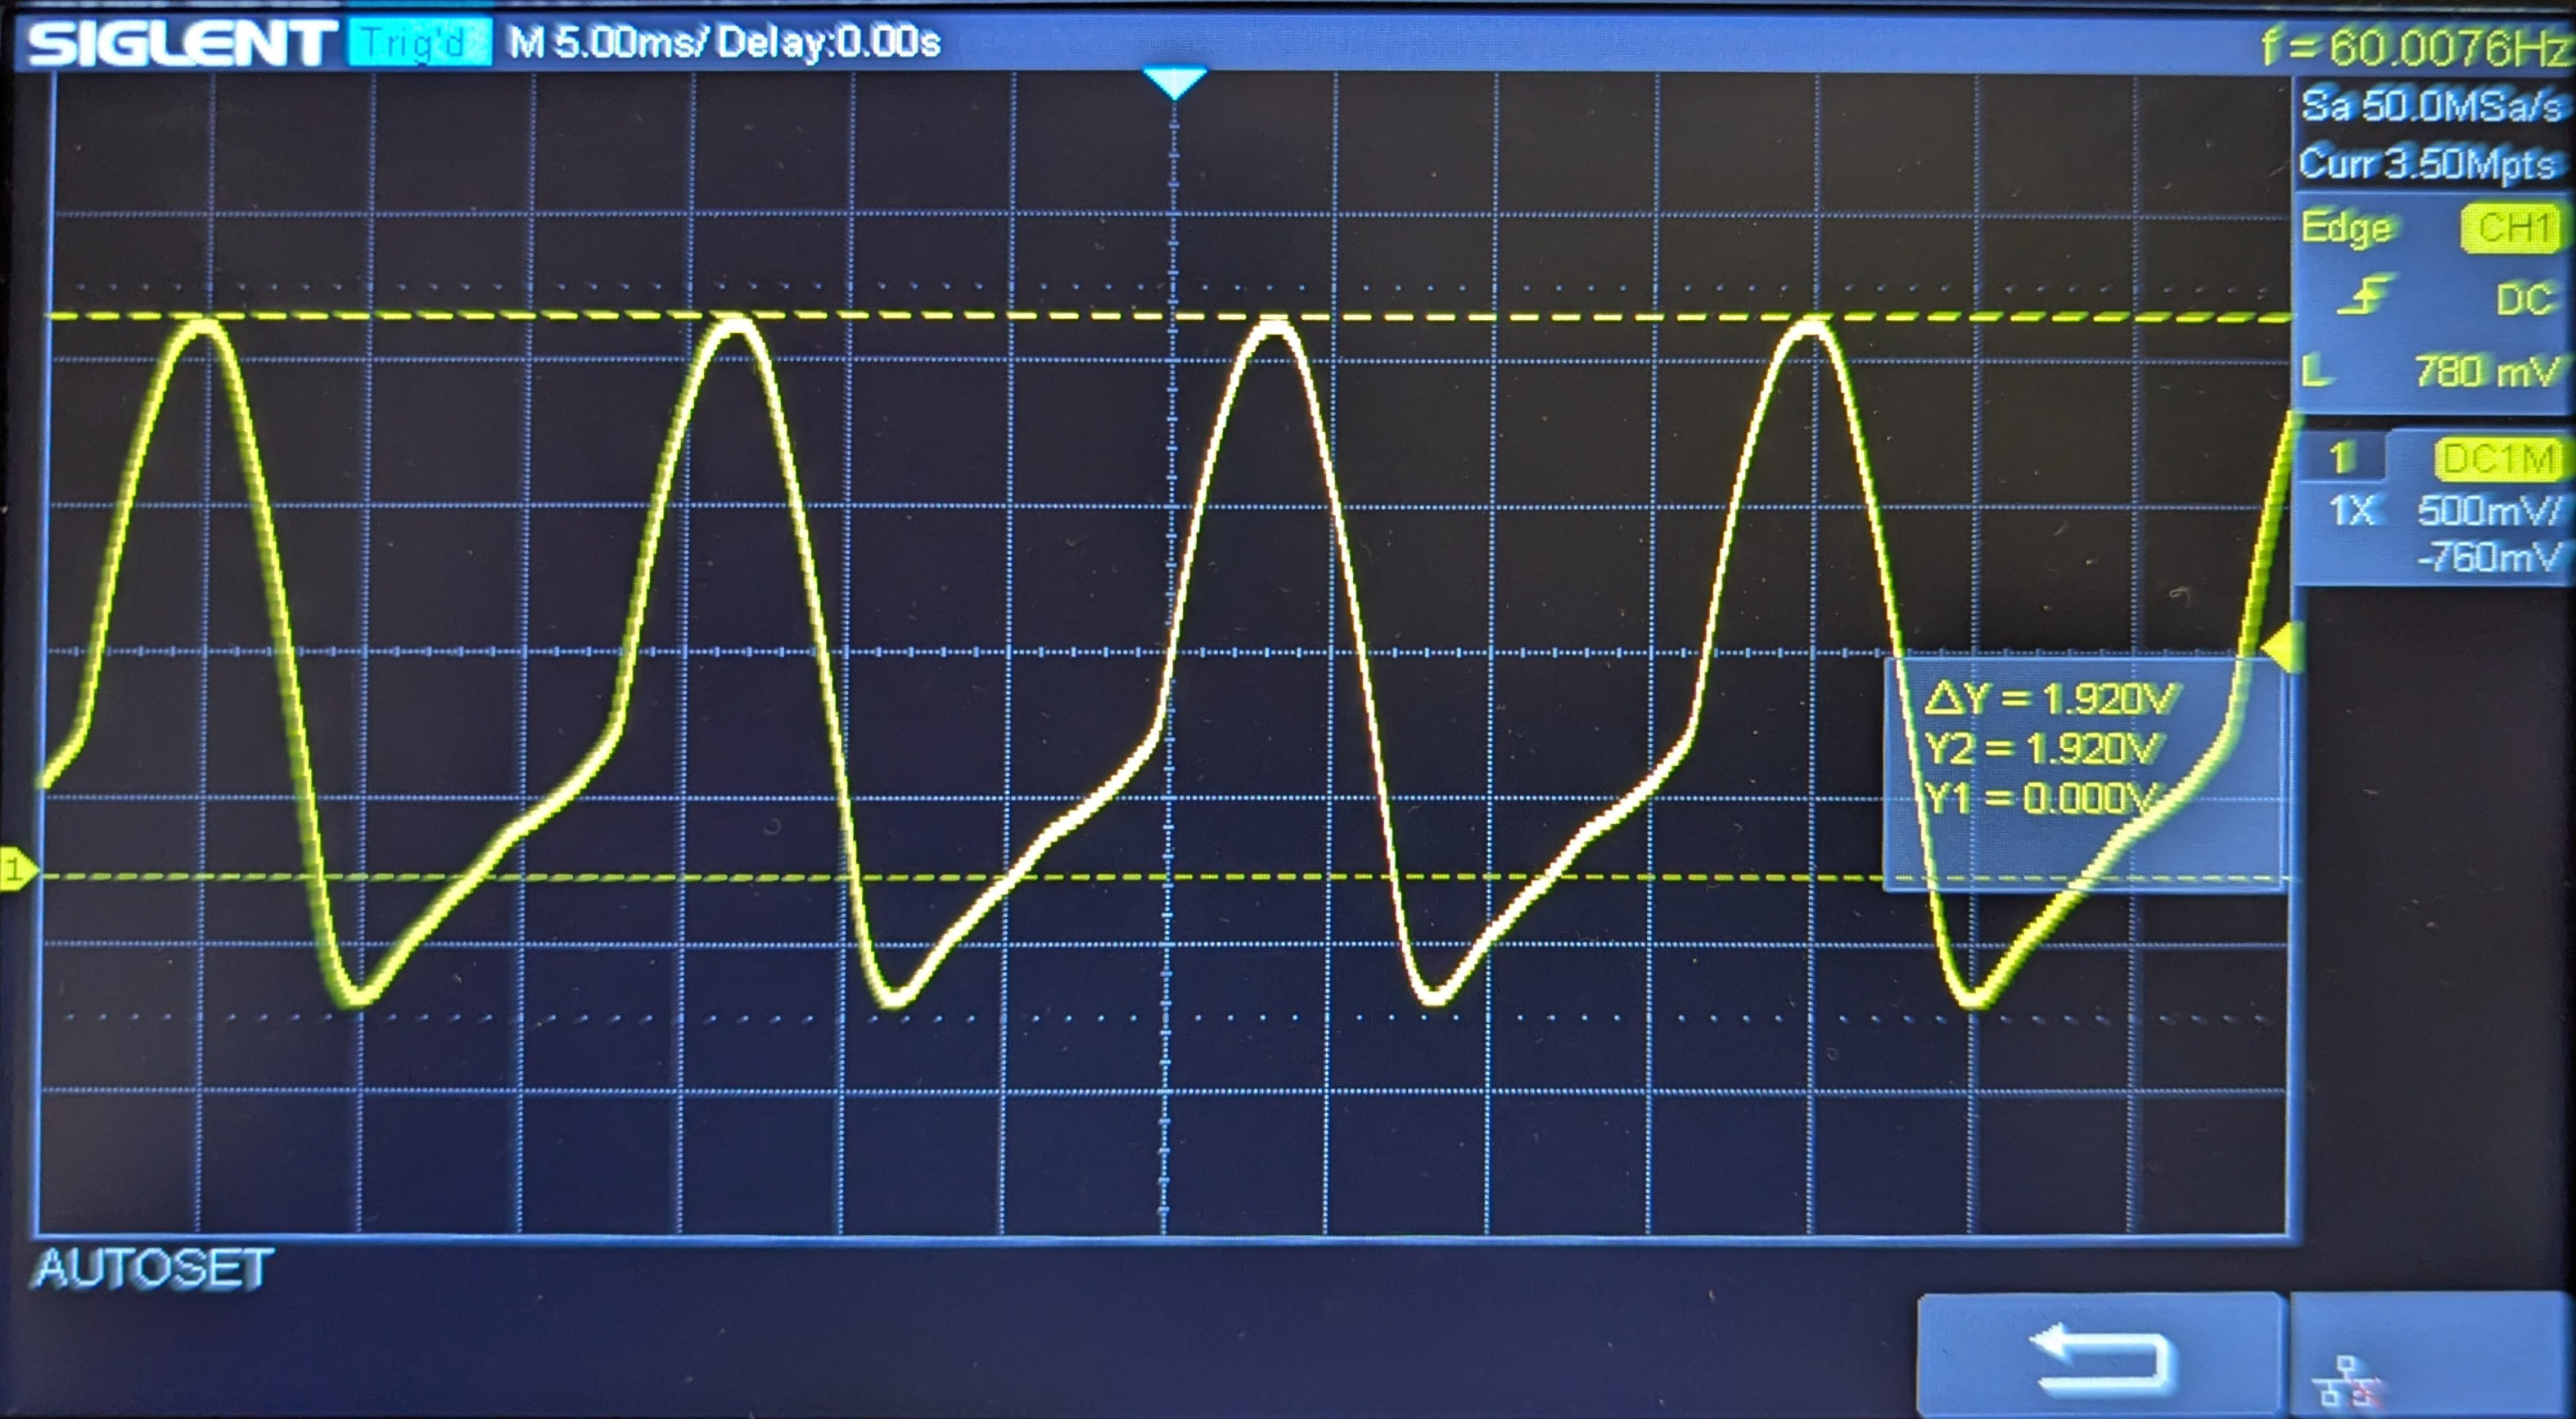
Note: all of these curves look similar. The negative part of the sine wave has been eliminated. As the capacity of the diode increases, the baseline rises slowly, then breaks through. This represents a threshold in which the amount of current has finally breached the P-N junction of the diode. The lowest capacity diode (first image) gives the best 'saw tooth' pattern.
Table 1: Measurements using a 12Ω Resistor and a Diode in Series
| Capacity | Measurements | |||
|---|---|---|---|---|
| Name | A | V | Amp | Volt |
| 1N4001 | 1 | 50 | 0.51 | 1.93 |
| 1N4004 | 1 | 400 | 0.40 | 1.76 |
| 1N4007 | 1 | 1000 | 0.44 | 1.53 |
| 1N5404 | 3 | 400 | 0.20 | 1.45 |
| 1N5406 | 3 | 600 | 0.33 | 1.36 |
| 1N5408 | 3 | 1000 | 0.47 | 1.30 |
| 6A10 | 6 | 1000 | 0.55 | 1.17 |
| 10A10 | 10 | 1000 | 0.43 | 1.13 |
| 20A10 | 20 | 1000 | 0.41 | 1.11 |
Note: the voltage appears to drop as the capacity of the diode increases; however, the amperes seem to be variable.
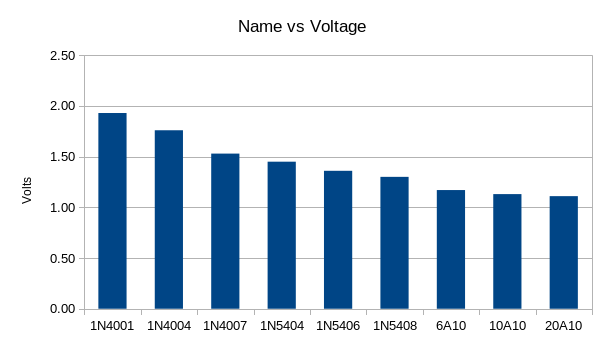
Note: The volts appear to diminish as the capacity of the diode increases.
The same alternating source (AC) is produced on the left. The 12 ohm resistor is removed to allow direct measurement of the three high-capacity diodes.
Test Results: High Capacity Diode Alone
 6A10 |
 10A10 |
 20A10 |
Table 2: Measurements using only a High-Capacity Diode
| Capacity | Measurements | |||
|---|---|---|---|---|
| Name | A | V | Amp | Volt |
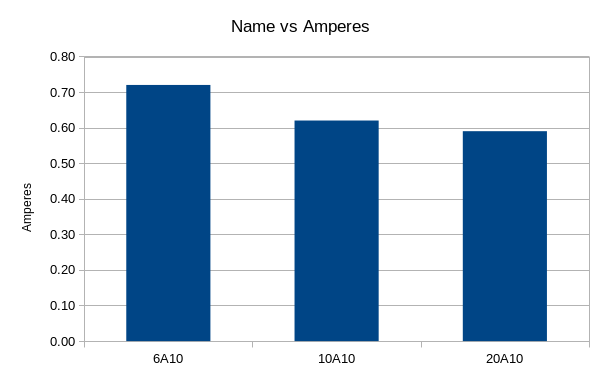
| 6A10 | 6 | 1000 | 0.72 | 1.92 |
| 10A10 | 10 | 1000 | 0.62 | 1.92 |
| 20A10 | 20 | 1000 | 0.59 | 1.92 |
Note: the amperes appear to drop as the capacity of the diode increases; however, the voltage stays fixed.
Note: The volts appear to diminish as the capacity of the diode increases.
In summary: the diode appears to diminish both the voltage and the ampere, but it has a far greater effect on the ampere. The voltage is reduced by about 8% where the ampere is reduced by 87%.